


 CDN NEWS |
  US NEWS


By Anna Shiryaevskaya
The virus has slashed energy use as vast swaths of the economy were forced to close. That prompted some importers to reduce LNG shipments or defer them for later. A new wave of LNG projects has been cast in doubt by plunging gas prices.
The group hasn’t yet quantified the impact it expects on the industry. The following three charts show highlights of the industry’s expansion last year.
Import Dynamics
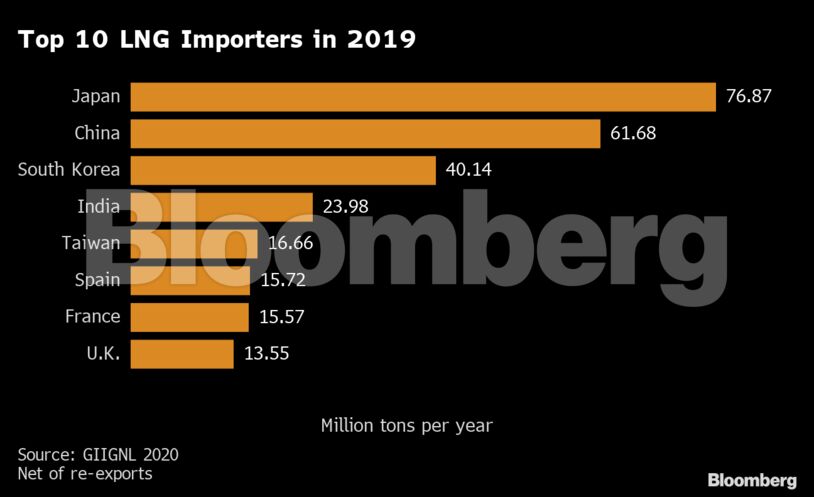
While the number of importing countries remained unchanged at 42, Europe stood out with a 76% increase in net purchases from a year earlier, helping absorb the glut.
Asia remained the leading consuming region, though its share of total imports fell to 69% from 76% in 2018. Shipments into all countries except the established markets of Japan, South Korea and Taiwan rose, though China’s growth slowed to 14% from 38% a year earlier.


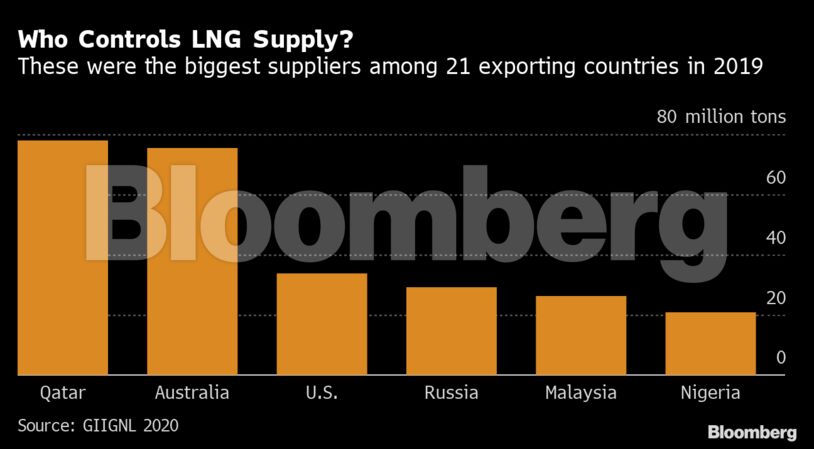
Export Moves
The U.S. was the fastest-growing producer and Europe became its main market, taking 38% of its exports. Russia expanded its output with the Yamal LNG plant.
The chart below shows the U.S. moving to become the third-biggest exporter, while Qatar maintained its crown with a slight edge over Australia.
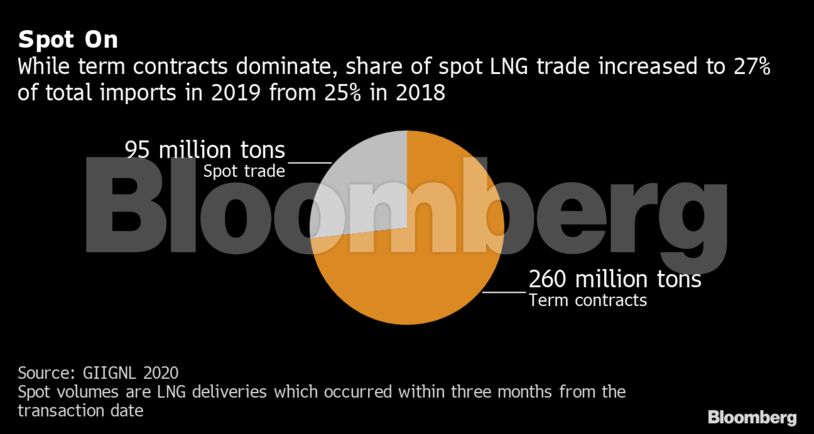
Trading and Shipping
U.S. supply helped further develop LNG trade. The nation became the biggest supplier of flexible fuel, accounting for a fifth of spot and short-term volumes.
Contracts with duration of less than four years accounted for 34% of total imports, up from 32% in 2018, GIIGNL said. Actual spot volumes, delivered within three months from a deal date, also marginally increased.
There were 601 LNG tankers as of the end of 2019, a net increase of 38 from a year earlier. The average spot charter rate for a 160,000 cubic meter vessel fell more than 20% in 2019 to $69,337 a day.
Share This:


