


 CDN NEWS |
  US NEWS


OKLAHOMA CITY, Feb. 22, 2018 /PRNewswire/ — Chesapeake Energy Corporation (NYSE:CHK) today reported financial and operational results for the 2017 full year and fourth quarter plus other recent developments. Highlights include:
- Average 2017 production of approximately 547,800 barrels of oil equivalent (boe) per day, up 3 percent compared to 2016 levels, adjusted for asset sales; oil production up 11 percent in 2017 fourth quarter compared to 2016 fourth quarter, adjusted for asset sales
- Reduced production, general and administrative and gathering, processing and transportation expenses by approximately $510 million, down 18 percent compared to 2016 levels
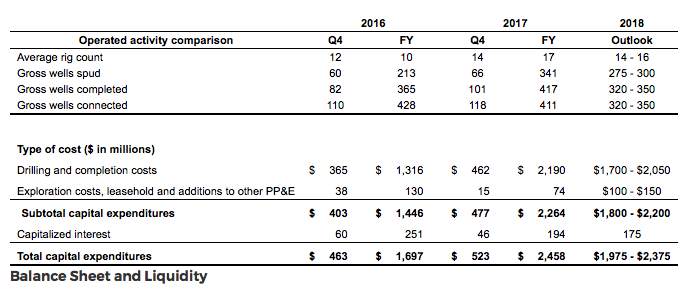
- Projected 2018 capital expenditures program of approximately $1.975 – $2.375 billion, down 12 percent compared to 2017 levels, using midpoint
- Total 2018 production, adjusted for asset sales, expected to grow approximately 3 percent year-over-year, using midpoint; oil volumes adjusted for asset sales, expected to grow by approximately 5 percent compared to 2017 levels, using midpoint
Doug Lawler, Chesapeake’s Chief Executive Officer, commented, “I am very pleased with our fourth quarter and full year 2017 performance, as we made significant progress toward our goals of reducing our debt, increasing cash flow generation and margin enhancement. Fiscal year 2017 was a pivotal year for Chesapeake, as we restored our production and increased net cash provided by operations, increased our oil production, adjusted for asset sales, and significantly improved our cost structure by reducing our combined production, general and administrative and gathering, processing, and transportation expenses by approximately $510 million. We further demonstrated the depth of our portfolio by closing on approximately $1.3 billion in asset and property sales and signed additional asset sales for approximately $575 million that we expect to close by the end of the 2018 second quarter. We reduced our outstanding secured term debt by approximately $1.3 billion, or 32 percent, continued to remove legal obligations and recorded the best environmental and safety performance in our company’s history.
“We are well-positioned to build on our 2017 accomplishments and progress our strategic goals, with our 2018 guidance highlighting improvements in our cost structure, increased oil production, adjusted for asset sales, and increased net cash and margins provided by operations. We expect to deliver production growth, adjusted for asset sales, of 1 percent to 5 percent on reduced capital expenditures. The expected improvements in our cost structure, as well as improved basis pricing differentials and higher NYMEX pricing, result in higher forecasted year-over-year cash flows.
“Over the last four years, we have fundamentally transformed our business, removing financial and operational complexity, significantly improving our balance sheet, and addressing numerous legacy issues that have affected past performance. Chesapeake Energy continues to get stronger, and we believe we are well positioned to create meaningful shareholder value in the years ahead.”
2017 Full Year Results
For the 2017 full year, Chesapeake reported net income of $953 million and net income available to common stockholders of $813 million, or $0.90 per diluted share. The company’s EBITDA for the 2017 full year was $2.376 billion. Adjusting items that are typically excluded by securities analysts, the 2017 full year adjusted net income attributable to Chesapeake was $742 million, or $0.82 per diluted share, while the company’s adjusted EBITDA was $2.160 billion. Reconciliations of financial measures calculated in accordance with GAAP to non-GAAP measures are provided on pages 12 – 16 of this release.
Chesapeake’s oil, natural gas and NGL unhedged revenue increased by 18 percent year over year due to an increase in average price despite a 14 percent reduction in production volumes sold. Average daily production for 2017 of approximately 547,800 boe increased by 3 percent compared to 2016 levels, adjusted for asset sales, and consisted of approximately 89,500 barrels (bbls) of oil, 2.406 billion cubic feet (bcf) of natural gas and 57,300 bbls of NGL.
During the full year production expenses were $2.81 per boe, while general and administrative expenses (including stock-based compensation) were $1.31 per boe. Combined production and general and administrative expenses during the 2017 full year were $4.12 per boe, an increase of 1 percent year over year. Gathering, processing, and transportation expenses during the 2017 full year were $7.36 per boe, a decrease of 8 percent year over year.
2017 Fourth Quarter Results
For the 2017 fourth quarter, Chesapeake reported net income of $334 million and net income available to common stockholders of $309 million, or $0.33 per diluted share. The company’s EBITDA for the 2017 fourth quarter was $764 million. Adjusting for items that are typically excluded by securities analysts, the 2017 fourth quarter adjusted net income attributable to Chesapeake was $314 million, or $0.30 per diluted share, while the company’s adjusted EBITDA was $706 million. Reconciliations of financial measures calculated in accordance with GAAP to non-GAAP measures are provided on pages 12 – 16 of this release.
Chesapeake’s oil, natural gas and NGL unhedged revenue in the fourth quarter increased 16 percent year over year due to a 3 percent increase in volumes and an increase in commodity prices. Average daily production for the 2017 fourth quarter of approximately 593,200 boe increased by 15 percent over 2016 fourth quarter levels and 10 percent sequentially, adjusted for asset sales, and consisted of approximately 99,900 bbls of oil, 2.603 bcf of natural gas and 59,500 bbls of NGL.
Production expenses during the 2017 fourth quarter were $2.50 per boe, while general and administrative expenses (including stock-based compensation) during the 2017 fourth quarter were $1.34 per boe. Combined production and general and administrative expenses during the 2017 fourth quarter were $3.84 per boe, a decrease of 10 percent year over year and a decrease of 7 percent quarter over quarter. Gathering, processing, and transportation expenses during the 2017 fourth quarter were $7.15 per boe, a decrease of 10 percent year over year and a decrease of 3 percent quarter over quarter.
Capital Spending Overview
Chesapeake’s total capital investments were approximately $2.458 billion during the 2017 full year, compared to approximately $1.697 billion in the 2016 full year. A summary of the company’s 2017 and 2016 capital expenditures, as well as the current 2018 capital expenditure guidance, is provided in the table below.
As of December 31, 2017, Chesapeake’s principal debt balance was approximately $9.981 billion, compared to $9.989 billion as of December 31, 2016. The company’s liquidity as of December 31, 2017was approximately $2.893 billion, which included cash on hand and undrawn borrowing capacity of approximately $2.888 billion under the company’s senior secured revolving credit facility. As of December 31, 2017, the company had $781 million of outstanding borrowings under the revolving credit facility and had used $116 million of the revolving credit facility for various letters of credit.
The company recently signed additional asset sales agreements for properties in the Mid-Continent, including our Mississippian Lime assets, for approximately $500 million in proceeds that we expect to close by the end of the 2018 second quarter. In addition, the company sold approximately 4.3 million shares of FTS International, Inc. (NYSE: FTSI) for approximately $74 million in net proceeds and continues to hold approximately 22.0 million shares in the publicly traded company. FTSI is a provider of hydraulic fracturing services in North America and a company in which Chesapeake has owned a significant stake since 2006. FTSI completed its initial public offering of common shares on February 6, 2018. The proceeds from these divestitures will go toward reducing Chesapeake’s outstanding borrowings under its revolving credit facility, to repurchase high coupon debt to reduce annual interest expense, based on market conditions.
Operations Update
Chesapeake’s average daily production for the 2017 full year was approximately 547,800 boe compared to approximately 635,400 boe in the 2016 full year. A summary of the company’s 2017 average daily production and average daily sales prices received by the company’s operating divisions can be found in the company’s Form 10-K.
Chesapeake’s average daily production for the 2017 fourth quarter was approximately 593,200 boe compared to approximately 574,500 boe in the 2016 fourth quarter. The following tables show average daily production and average daily sales prices received by the company’s operating divisions for the 2017 fourth quarter.

In the Powder River Basin (PRB), strong results from Chesapeake’s latest well placed on production in the Turner formation provides additional confirmation of the PRB’s potential resource. In December 2017, the LEBAR 15-34-69 A TR 22H well was placed on production in the gas condensate window of the Turner with a lateral length of approximately 10,100 feet. This well reached a peak rate of 2,600 boe per day (50% oil) and has cumulatively produced 115,000 boe (50% oil) in its first 60 days of production. The LEBAR well is currently producing approximately 2,000 boe per day (45% oil) with a flowing tubing pressure of 2,600 psi after approximately 80 days on production. Chesapeake’s seventh producing well targeting the Turner formation, the BB 35-35-72 USA A TR 21H, was completed with a 9,677-foot lateral and is scheduled to be placed on production next week. In January 2018, Chesapeake placed three wells on production from the Sussex formation, averaging approximately 6,895 feet in lateral length, and achieving an average peak rate of 880 boe per day (90% oil), while still cleaning up. Chesapeake added a third rig in October 2017 and expects to add a fourth rig in April 2018. Chesapeake expects to place on production up to 33 wells in 2018, compared to 25 wells in 2017.
In the Eagle Ford Shale in south Texas, Chesapeake is currently utilizing five drilling rigs and expects to place on production up to 140 wells in 2018, compared to 166 wells in 2017.
In the Marcellus Shale in northeast Pennsylvania, Chesapeake is currently utilizing one drilling rig and expects to place on production up to 55 wells in 2018, compared to 43 wells in 2017. Chesapeake expects to keep its total gross operated production from the region effectively flat compared to 2017 at approximately 2.1 bcf per day.
In the Haynesville Shale in Louisiana, Chesapeake is currently utilizing three drilling rigs and expects to place on production up to 25 wells in 2018, compared to 36 wells in 2017. In December 2017, Chesapeake placed the Nabors 13&12-10-13 1HC well on production from the Bossier formation, its first ever Bossier horizontal well with a lateral length of more than 10,000 feet, which achieved a peak rate of 35.8 million cubic feet of gas per day.
In the Utica Shale in northeast Ohio, Chesapeake is currently utilizing two drilling rigs and expects to place on production up to 40 wells in 2018, compared to 67 wells in 2017.
In the company’s Mid-Continent operating area in Oklahoma, Chesapeake is currently utilizing one drilling rig and expects to place on production up to 40 wells in 2018, compared to 71 wells in 2017. Chesapeake expects to spud its first horizontal well targeting the Chester formation in Woods Countyin May 2018 and its first horizontal well targeting the Hunton formation in June 2018. If successful, Chesapeake could drill up to 10 additional Chester and Hunton tests in 2018.
Key Financial and Operational Results
The table below summarizes Chesapeake’s key financial and operational results during the 2017 fourth quarter and full year as compared to results in prior periods.
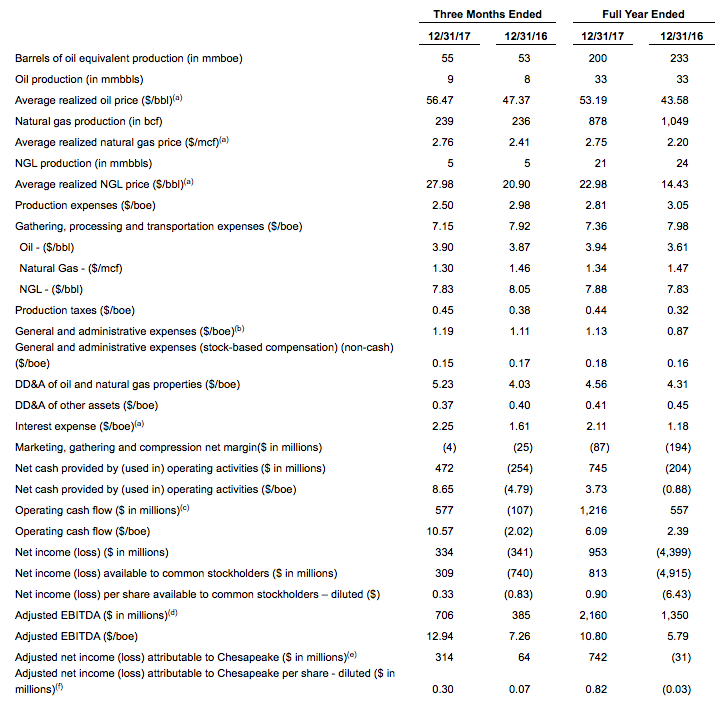
- Includes the effects of realized gains (losses) from hedging, but excludes the effects of unrealized gains (losses) from hedging.
- Excludes expenses associated with stock-based compensation, which are recorded in general and administrative expenses in Chesapeake’s Consolidated Statement of Operations.
- Defined as cash flow provided by operating activities before changes in components of working capital and other assets and liabilities. This is a non-GAAP measure. See reconciliation to cash provided by (used in) operating activities on page 14.
- Defined as net income (loss) before interest expense, income taxes and depreciation, depletion and amortization expense, as adjusted to remove the effects of certain items detailed on page 16. This is a non-GAAP measure. See reconciliation of net income (loss) to EBITDA on page 14 and reconciliation of EBITDA to adjusted EBITDA on page 16.
- Defined as net income (loss) attributable to Chesapeake, as adjusted to remove the effects of certain items detailed on pages 12 – 13. This is a non-GAAP measure. See reconciliation of net income to adjusted net income (loss) available to Chesapeake on pages 12-13.
- Our presentation of diluted adjusted net income (loss) attributable to Chesapeake per share excludes 60 million and 211 million shares for the three months ended December 31, 2017 and 2016, respectively, and 207 million and 247 million shares for the years ended December 31,2017 and 2016, respectively, considered antidilutive when calculating diluted earnings per share.
2017 Fourth Quarter and Year-End Financial and Operational Results Conference Call Information
A conference call to discuss this release has been scheduled on Thursday, February 22, 2018 at 9:00 am EDT. The telephone number to access the conference call is 719-325-4837 or toll-free 877-419-6600. The passcode for the call is 4866677. The number to access the conference call replay is 719-457-0820 or toll-free 888-203-1112 and the passcode for the replay is 4866677. The conference call will be webcast and can be found at www.chk.com in the “Investors” section of the company’s website. The webcast of the conference will be available on the website for one year.
Headquartered in Oklahoma City, Chesapeake Energy Corporation’s (NYSE: CHK) operations are focused on discovering and developing its large and geographically diverse resource base of unconventional oil and natural gas assets onshore in the United States.
This news release and the accompanying Outlook include “forward-looking statements” within the meaning of Section 27A of the Securities Act of 1933 and Section 21E of the Securities Exchange Act of 1934. Forward-looking statements are statements other than statements of historical fact. They include statements that give our current expectations, management’s outlook guidance or forecasts of future events, production and well connection forecasts, estimates of operating costs, anticipated capital and operational efficiencies, planned development drilling and expected drilling cost reductions, anticipated timing of wells to be placed into production, general and administrative expenses, capital expenditures, the timing of anticipated asset sales and proceeds to be received therefrom, the expected use of proceeds of anticipated asset sales, projected cash flow and liquidity,our ability to enhance our cash flow and financial flexibility, plans and objectives for future operations, the ability of our employees, portfolio strength and operational leadership to create long-term value, and the assumptions on which such statements are based. Although we believe the expectations and forecasts reflected in the forward-looking statements are reasonable, we can give no assurance they will prove to have been correct. They can be affected by inaccurate or changed assumptions or by known or unknown risks and uncertainties.
Factors that could cause actual results to differ materially from expected results include those described under “Risk Factors” in Item 1A of our annual report on Form 10-K and any updates to those factors set forth in Chesapeake’s subsequent quarterly reports on Form 10-Q or current reports on Form 8-K (available at http://www.chk.com/investors/sec-filings). These risk factors include the volatility of oil, natural gas and NGL prices; the limitations our level of indebtedness may have on our financial flexibility; our inability to access the capital markets on favorable terms; the availability of cash flows from operations and other funds to finance reserve replacement costs or satisfy our debt obligations; downgrade in our credit rating requiring us to post more collateral under certain commercial arrangements; write-downs of our oil and natural gas asset carrying values due to low commodity prices; our ability to replace reserves and sustain production; uncertainties inherent in estimating quantities of oil, natural gas and NGL reserves and projecting future rates of production and the amount and timing of development expenditures; our ability to generate profits or achieve targeted results in drilling and well operations; leasehold terms expiring before production can be established; commodity derivative activities resulting in lower prices realized on oil, natural gas and NGL sales; the need to secure derivative liabilities and the inability of counterparties to satisfy their obligations; adverse developments or losses from pending or future litigation and regulatory proceedings, including royalty claims; charges incurred in response to market conditions and in connection with our ongoing actions to reduce financial leverage and complexity; drilling and operating risks and resulting liabilities; effects of environmental protection laws and regulation on our business; legislative and regulatory initiatives further regulating hydraulic fracturing; our need to secure adequate supplies of water for our drilling operations and to dispose of or recycle the water used; impacts of potential legislative and regulatory actions addressing climate change; federal and state tax proposals affecting our industry; potential OTC derivatives regulation limiting our ability to hedge against commodity price fluctuations; competition in the oil and gas exploration and production industry; a deterioration in general economic, business or industry conditions; negative public perceptions of our industry; limited control over properties we do not operate; pipeline and gathering system capacity constraints and transportation interruptions; terrorist activities and cyber-attacks adversely impacting our operations; an interruption in operations at our headquarters due to a catastrophic event; certain anti-takeover provisions that affect shareholder rights; and our inability to increase or maintain our liquidity through debt repurchases, capital exchanges, asset sales, joint ventures, farmouts or other means.
In addition, disclosures concerning the estimated contribution of derivative contracts to our future results of operations are based upon market information as of a specific date. These market prices are subject to significant volatility. Our production forecasts are also dependent upon many assumptions, including estimates of production decline rates from existing wells and the outcome of future drilling activity. Expected asset sales may not be completed in the time frame anticipated or at all. We caution you not to place undue reliance on our forward-looking statements, which speak only as of the date of this news release, and we undertake no obligation to update any of the information provided in this release or the accompanying Outlook, except as required by applicable law. In addition, this news release contains time-sensitive information that reflects management’s best judgment only as of the date of this news release.
Investor Contact:
Brad Sylvester, CFA
(405) 935-8870
[email protected]
Media Contact:
Gordon Pennoyer
(405) 935-8878
[email protected]
Share This:


