


 CDN NEWS |
  US NEWS


A brief summary of the most recent Energy Institute publication
[image]
Any of you who follow me know that I love this time of year. The Energy Institute publishes a global energy summary of energy consumption (and a bunch of other data) for broad consumption by the public. What I love about it is that this is data. You can say what you want about various types of energy, but at the end of the day data drives to answers, as popular or unpopular as that may be. So, let’s get jump in.
Total Energy Consumption
I will cut to the chase. Overall energy consumption continues to grow on a year over year basis, and this past year saw energy consumption grow by 1.4% or 8.1 EJ. The largest contributor to that growth in consumption came from the Asia Pacific region (+3.2 EJ), while the lowest growth came from the CIS (+0.2 EJ).
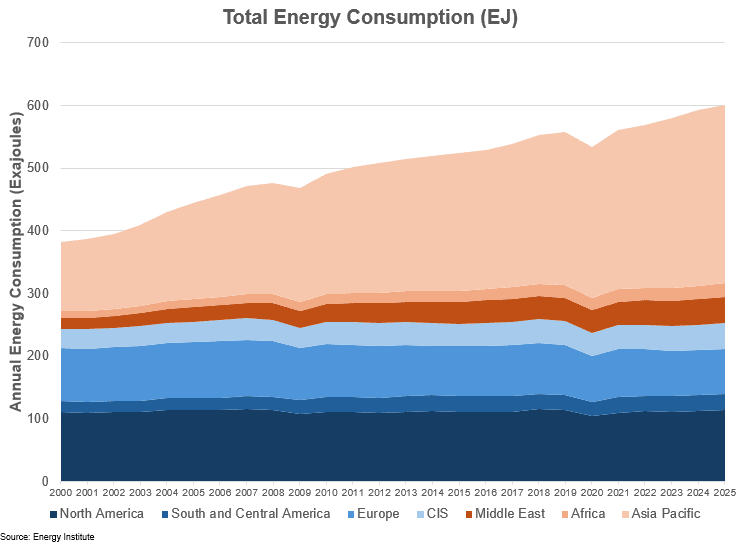
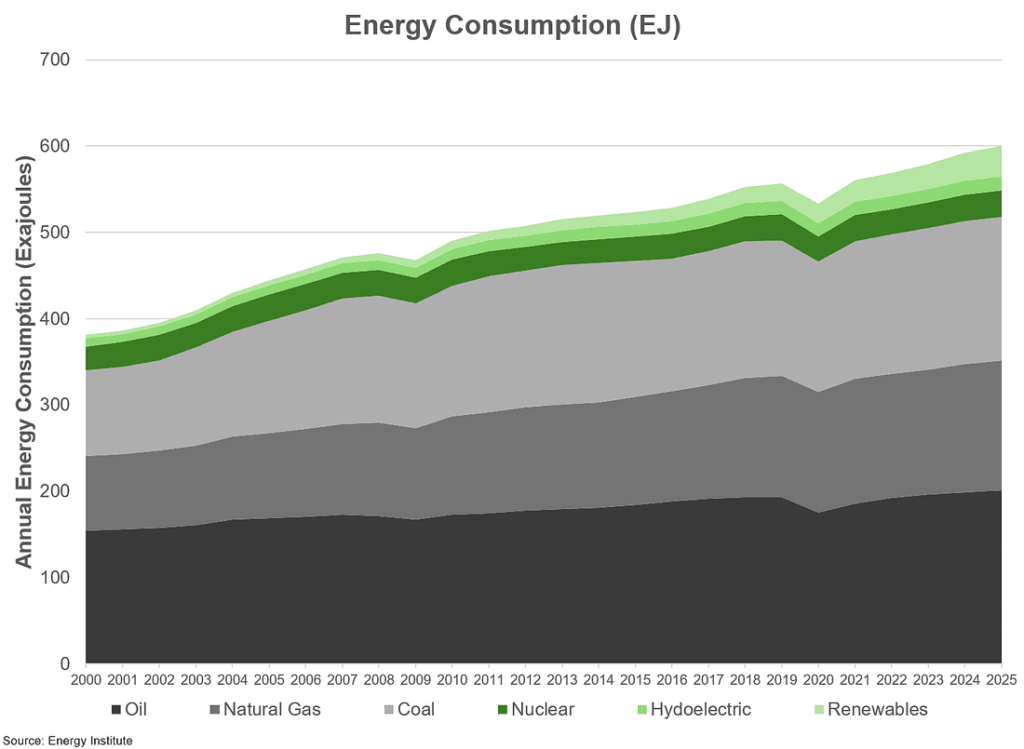
Perhaps just as interesting is the mix of that energy consumption, and this is something that I have been discussing for some time now. As mentioned previously, overall energy consumption grew by 1.4% or 8.1 EJ. The largest contributor to that growth came from renewables, which saw overall consumption grow by 3.2 EJ or 9.9%. However just as interesting was that ALL forms of energy consumption grew in 2025, and when you group all 3 hydrocarbon sources together (oil + natural gas + coal), they grew by 4.6 EJ and accounted for 56% of total growth.
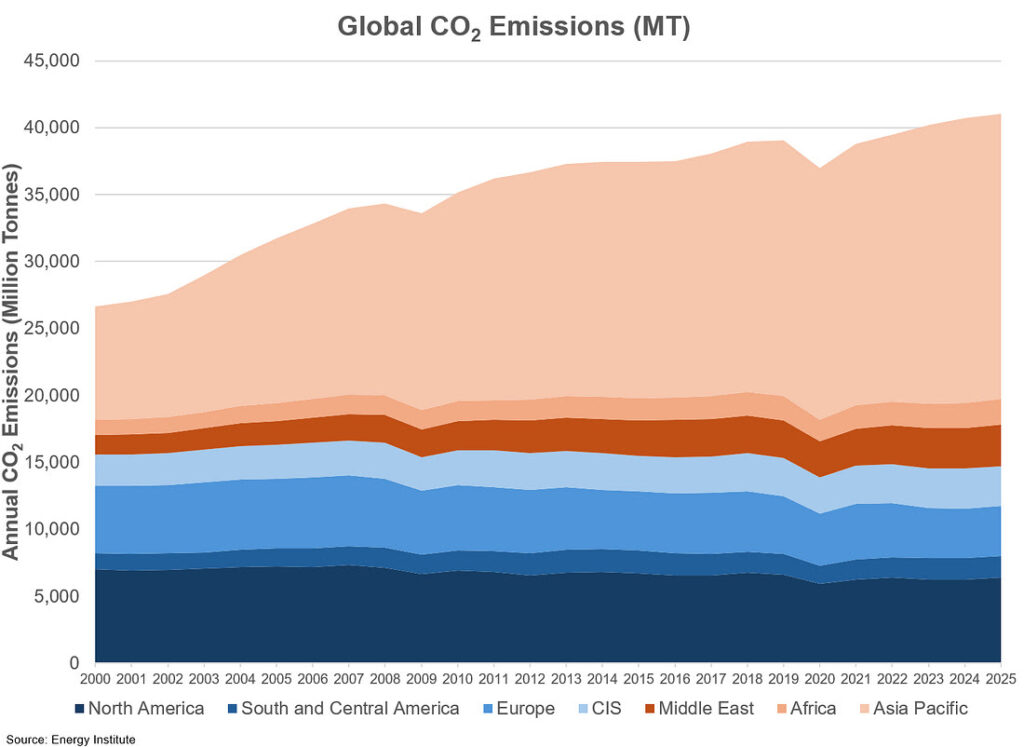
Total CO2 Emissions
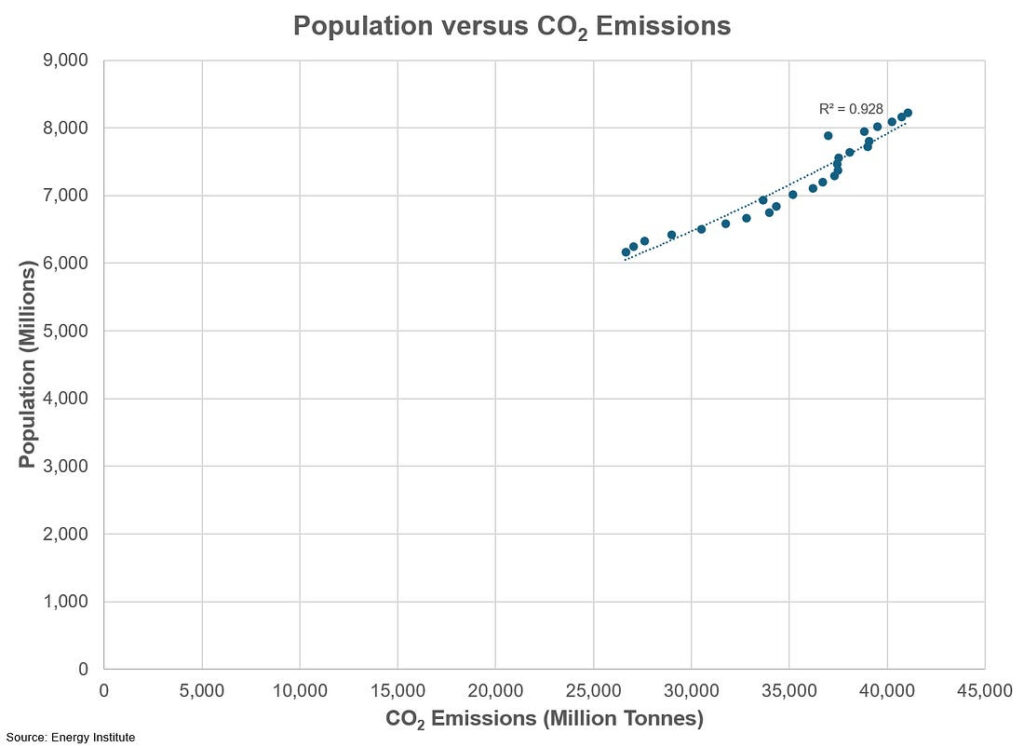
The other focal point is CO2 emissions. In 2025, we saw emissions continuing to grow, increasing by almost 331 million tonnes. All regions saw emissions increase. The notable increase in emissions came from the United States (+147 million tonnes, far outweighing any other country) with the largest decrease coming from Japan (-25 million tonnes).
Population
The last part of the discussion, for me, comes down to population. In 2025 we saw the globe continue to grow, increasing by almost 70 million people. The largest growth in population came from India (+14.0 million) while China saw a decrease in its population (-3.2 million) When you look at population growth and energy consumption, the trend is undeniable.
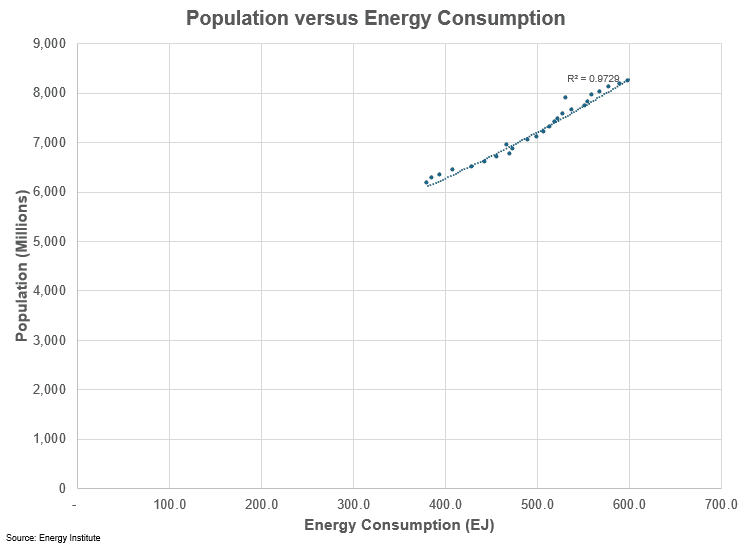
Similarly, when you look at overall emissions, the correlation with population is clear.


Below, I have included more detailed consumption information by fuel source for your review. In short, the energy question is a complicated one. For now, the one thing is clear. The world is seeking more of all sources of energy.
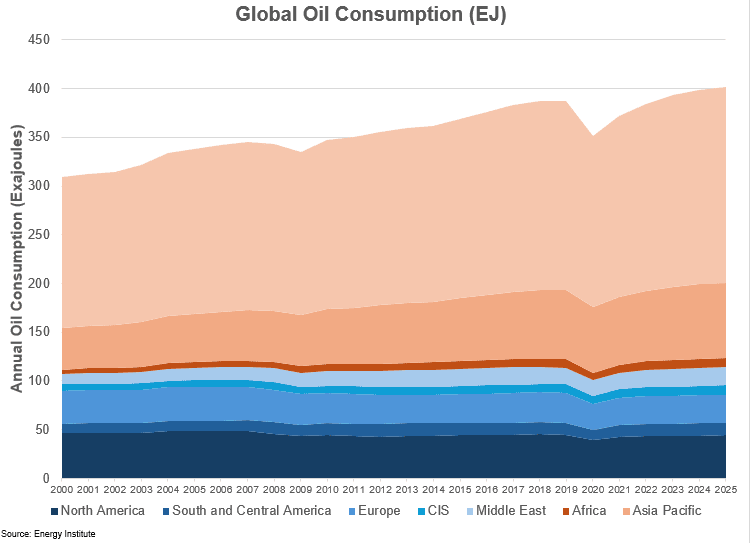
Oil
Another year, another record in terms of oil consumption. During the past year it is estimated that overall energy consumption from oil increased by 1.0% or 1.9 EJ (+1.3 million barrels per day) versus 2024. The biggest increase in consumption was driven by the Asia Pacific region (up 666,000 barrels per day) while Europe saw a very modest decline (-1,000 barrels per day)
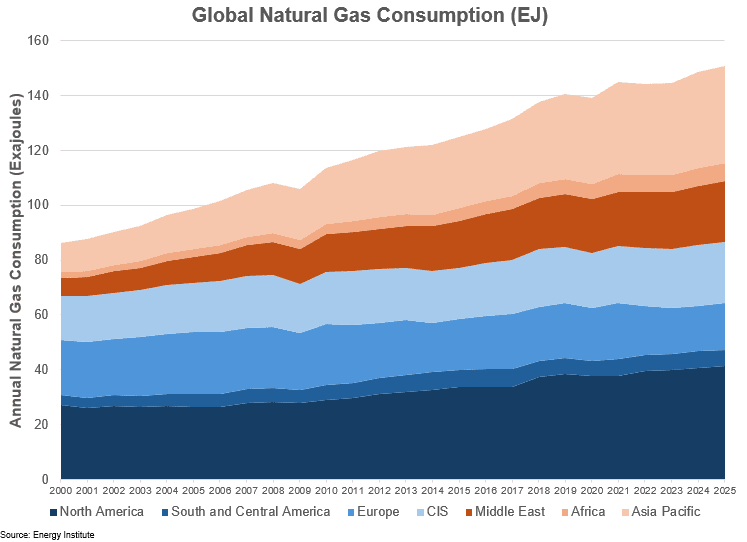
Natural Gas
Similar to crude oil, natural gas consumption also was on the uptrend, increasing by 1.3% or 2.0 EJ (+6.4 Bcf/day) versus the prior year. The largest growth in natural gas consumption, and it may come as a surprise to some, was in Europe (+1.9 bcf/day) while in South and Central America consumption actually went slightly lower (-0.2 bcf/day).
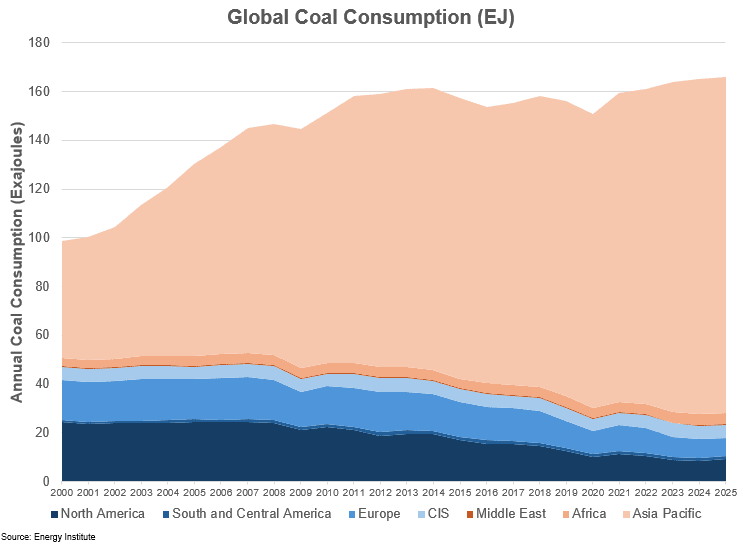
Coal
Big bad coal. This is always an interesting datapoint to look at, simply because of all the negative headlines associated with the product. For 2025 overall consumption continued to inch higher, increasing by 0.4% or 0.7 EJ. The biggest increase was seen in the North America (the United States in particular), where consumption increased by 8.7% (+0.7 EJ) while the largest decrease was seen in Europe (-0.3 EJ)
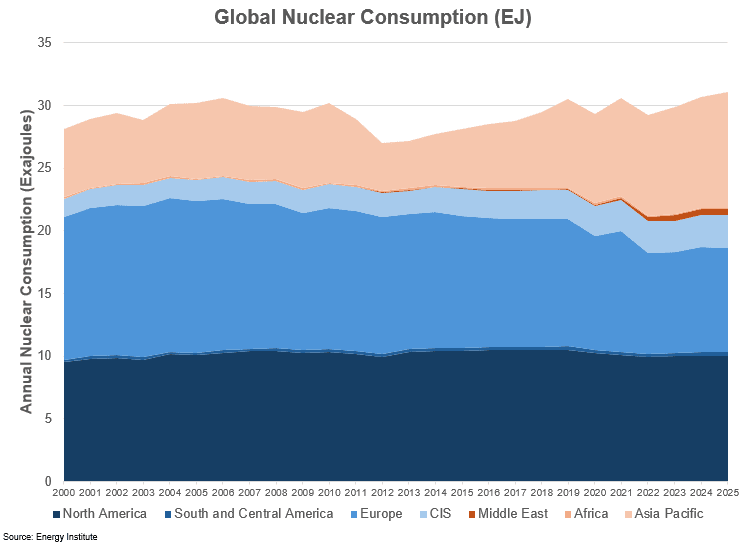
Nuclear
As we keep hearing, we are in a nuclear renaissance, albeit any real changes that we see in terms of generation are likely a decade plus away for most parts of the world. That said, overall consumption did continue to trend higher, increasing by 0.3 EJ versus last year. The largest growth was seen in the Asia Pacific region (+0.3 EJ) while Europe saw a slight decline (-0.1 EJ).
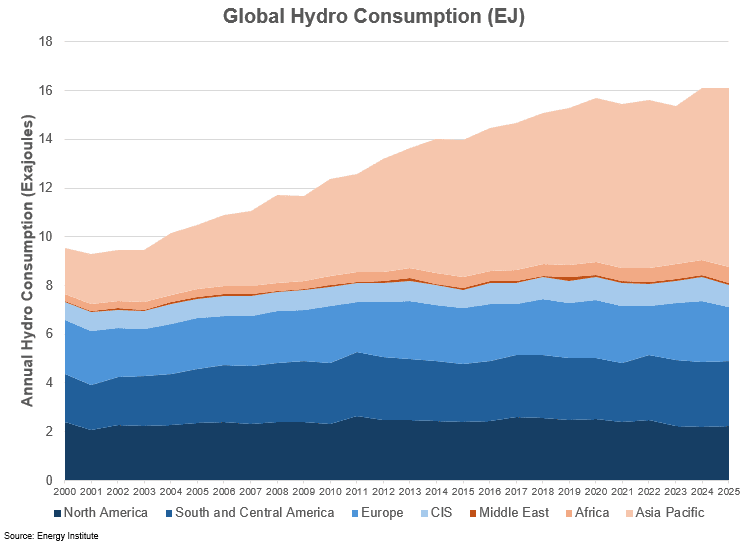
Hydro
Not surprising (to me at least) was that hydro was relatively unchanged versus the prior year. Why am I not surprised? Most sources that are viable to have a dam, do. As such, overall hydro consumption inched higher by 0.1% or 0.02 EJ. The biggest increase was seen in the Asia Pacific region (+0.3 EJ) while Europe saw a similar decline in consumption (-0.3 EJ).
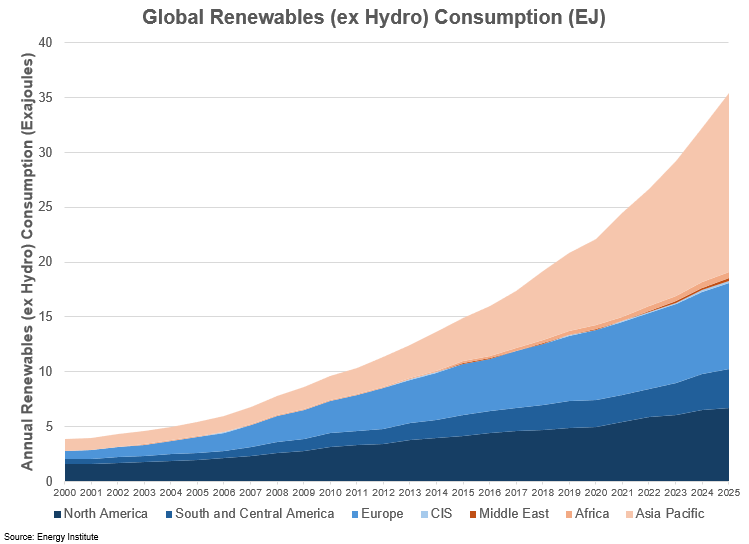
Renewables
Last, but definitely not least, is the renewables sector. It is here where you see the largest growth in terms of percentages, albeit you are starting from a lower base. Overall, the space saw consumption grow by 9.9% or 3.2 EJ. The largest growth was seen in the Asia Pacific (+2.2 EJ) while the CIS saw no real change versus the year prior.
Share This:


COMMENTARY: 2025 Review of Global Energy Consumption – William Lacey