


 CDN NEWS |
  US NEWS


LITTLETON, Colorado, March 9 (Reuters) – The sudden stoppage of LNG exports from Qatar – the world’s second-largest exporter in 2025 – has sent natural gas prices soaring by 50% from year-ago levels across Europe and Asia and has prompted panicked buyers to seek out replacement cargoes.
However, a shortage of available vessels and limited spare liquefaction capacity is restricting the number of liquefied natural gas cargoes available for immediate delivery to either region, and is likely to keep gas prices elevated for some time.
That said, major LNG exporters outside the Middle East are re-routing whatever shipments they can to needy buyers, spurred on by bumper profit potential created by the widening premium of gas prices in Asia and Europe over local prices.
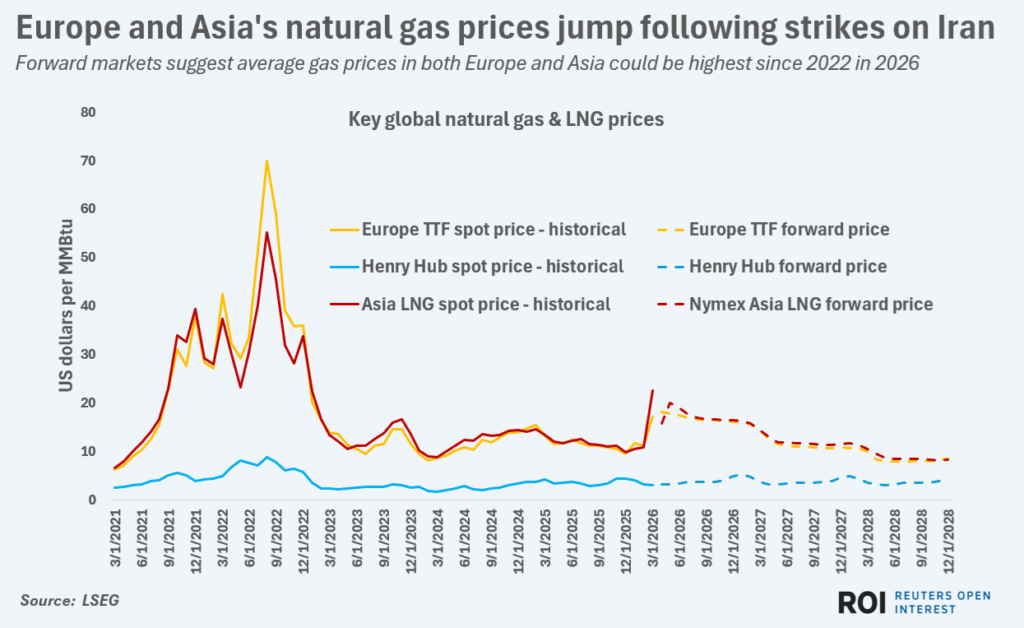
Forward markets suggest average gas prices in both Europe and Asia could be highest since 2022 in 2026
Here’s a breakdown of the latest natural gas price action in key markets that is likely to drive further cargo diversions, as well as the current LNG export flows from key suppliers.
PRIMED FOR PROFIT
Exporters in the U.S. are likely best placed to capitalize on the redirection opportunities, as the top global exporter likely has the greatest volumes of undeclared capacity available for spot shipment.
However, exporters in Australia, Russia, Malaysia and Nigeria – the next largest LNG shippers, according to Kpler – will likely also adjust delivery schedules and locations after the steep run-up in natural gas prices in Asia and Europe.
LNG forward contracts for delivery to key markets in Asia currently average around $12.95 per million British thermal units (MMBtu) for 2026 as a whole, data from LSEG shows.
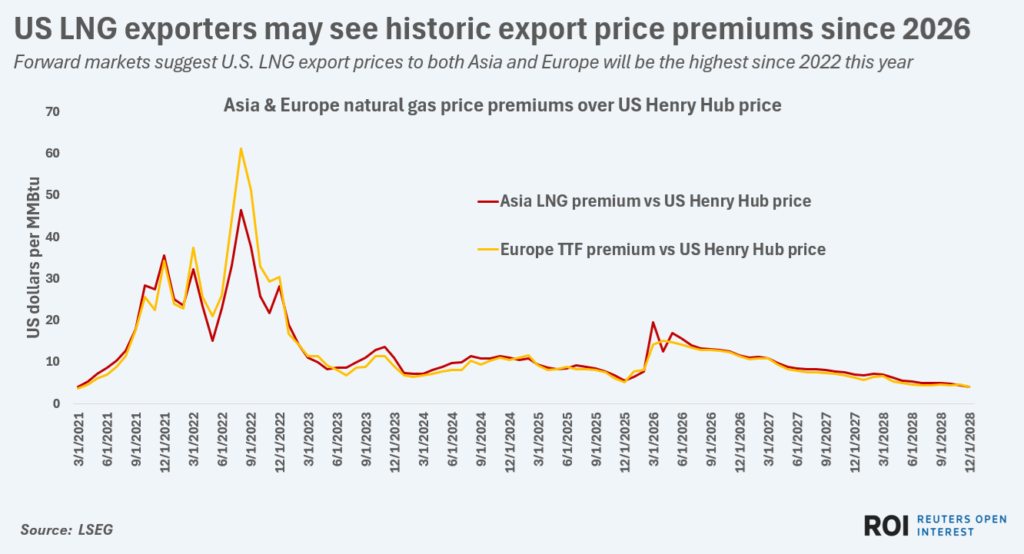
Forward markets suggest U.S. LNG export prices to both Asia and Europe will be the highest since 2022 this year
That marks a 53% rise compared to 2025’s average levels, and would mark the highest annual average since 2022.
In Europe, benchmark TTF futures for 2026 currently average around $12.41 per MMBtu, which marks a 49% increase from 2025’s average.
While those forward prices are bound to shift dramatically over the coming weeks in response to the ongoing market gyrations, it is instructive to take a snapshot of the current picture in order to assess potential arbitrage opportunities.
U.S. exporters face projected average natural gas costs of around $3.63 per MMBtu in 2026 – per current LSEG data – and so could score profits of more than 200% even after accounting for liquefaction and shipping costs to either Europe or Asia.
The profit potential is less clear for other exporters such as Australia and Russia, due to more opaque gas and liquefaction cost levels.
Nonetheless, as long as Europe’s and Asia’s gas costs remain close to current levels, it can be safely assumed that all LNG exporters face historic profit potential if they could effectively divert cargoes to those markets.


TRADE FLOW TRACKING
LNG analysts are already closely scrutinizing shipment patterns from major exporters for signs of sudden diversions.
The U.S. shipped 68% of its LNG to Europe in 2025, and is expected to continue prioritising Europe over other regions due to the comparably low cost of shipping to Europe.
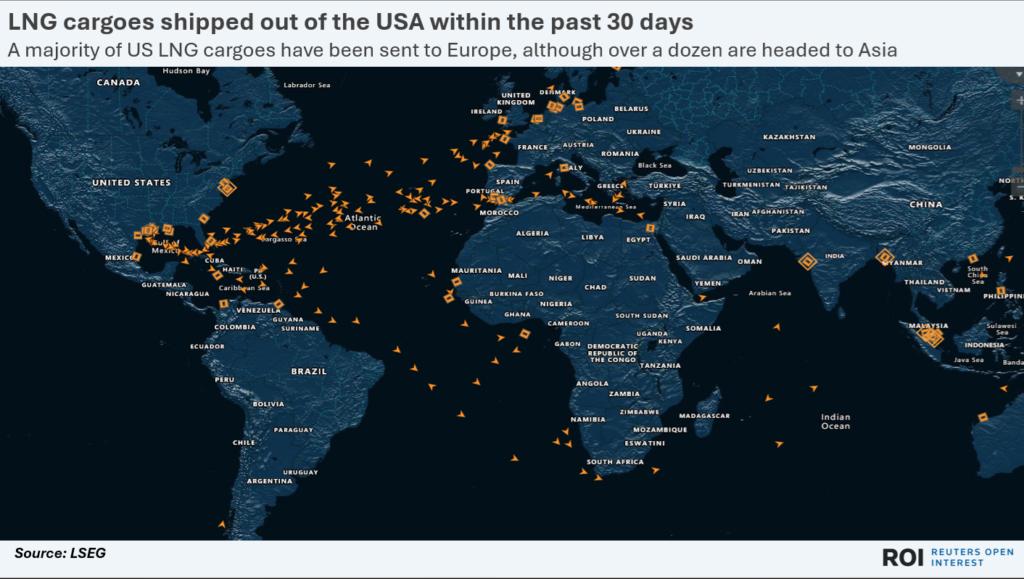
A majority of US LNG cargoes have been sent to Europe, although over a dozen are headed to Asia
That said, loading schedules for the first three months of the year indicate that U.S. exporters raised shipments to Asian buyers by nearly 20% compared to the same period in 2025.
Asia-bound tonnage from the U.S. for the first quarter of 2026 is estimated at 3.75 million metric tons, compared to 3.16 million tons for the same period in 2025, data from Kpler shows.
U.S. shipments to Europe from January to March are estimated at 22.7 million tons, compared to 19.8 million tons for the same months last year.
With buyers in both Asia and Europe set to remain strong bidders for LNG over the near to medium term, further increases in U.S. sales to both regions can be expected.
In contrast to U.S. trade flows, an overwhelming majority of shipments from Australian LNG exporters have been bound for customers in Asia, with Asia accounting for over 95% of Australian exports last year.
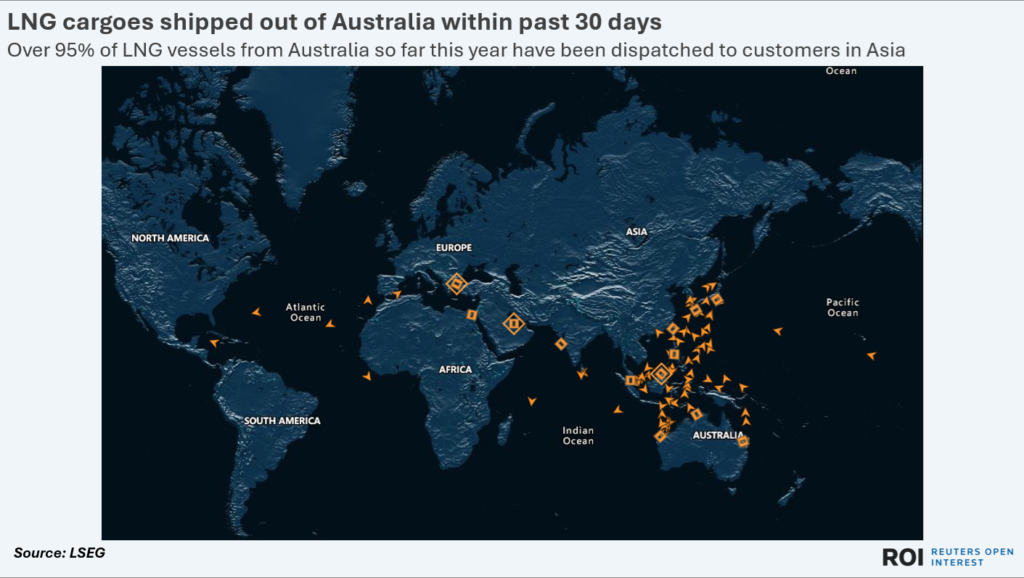
Over 95% of LNG vessels from Australia so far this year have been dispatched to customers in Asia
Relatively short transit times to the likes of China and Japan compared to cargoes shipped from the United States means that Australia retains a cost advantage to Asia buyers, as well as more extensive relations with regional buyers.
However, Australian LNG sellers have already committed close to all their projected supplies to contracted buyers, and so may have limited scope to redirect any shipments to the spot market where potential buyers are prepared to pay up for deliveries.
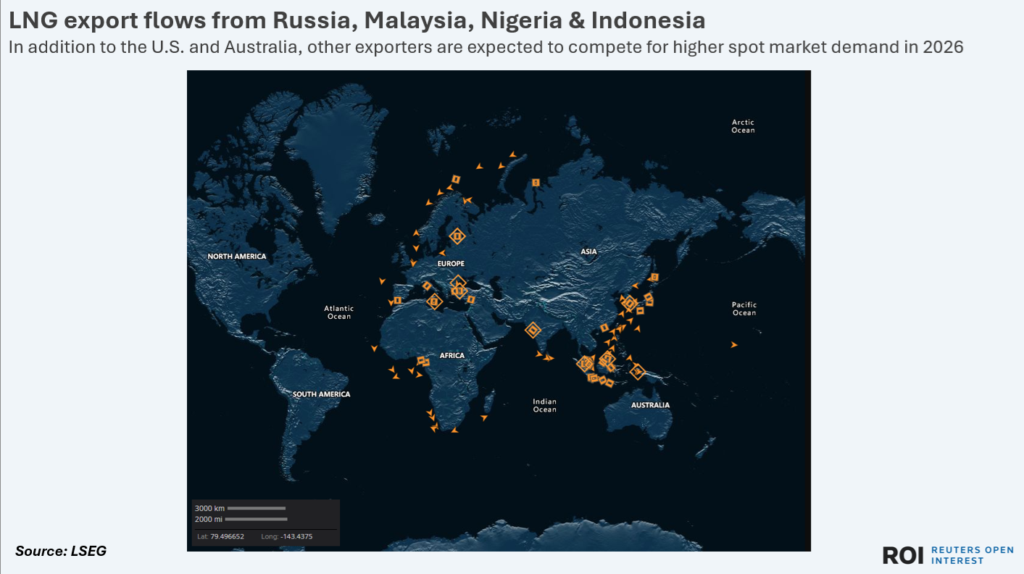
In addition to the U.S. and Australia, other exporters are expected to compete for higher spot market demand in 2026
That may leave openings for other exporters including Russia, Malaysia and Nigeria, which have already established global LNG trade routes and look well placed to offer further competition to their larger exporting peers going forward.
The opinions expressed here are those of the author, a columnist for Reuters.
Reporting by Gavin Maguire; Editing by Stephen Coates
Share This:


