


 CDN NEWS |
  US NEWS


By Ron Bousso

LONDON, Jan 15 (Reuters) – Simultaneous geopolitical flare‑ups in Venezuela, Iran and the Black Sea have pushed oil prices to a three‑month high, creating a treacherous environment for investors even as a large supply glut still looms over the market.
Brent crude opened the year at $61 a barrel before slipping below $60 after U.S. President Donald Trump shocked the world by ousting Venezuelan President Nicolas Maduro. The decline reflected expectations that Washington would quickly restore oil output and exports in a country sitting on the world’s largest proven reserves.
However, once the scarce details surrounding U.S. plans started trickling out, oil markets became somewhat less bearish.
Then came the protests in Iran and Trump’s threats to intervene in support of demonstrators facing a deadly crackdown. This situation helped push up prices 9% in a week to over $66 a barrel.
While regime change in Tehran could eventually result in more crude coming onto the open market, the immediate risk is supply disruption in an already volatile and unpredictable environment.
Adding to tensions in the Middle East and beyond, drones attacked two oil tankers in the Black Sea on Tuesday, including one chartered by U.S. energy major Chevron (CVX.N), as they approached a Russian coastal terminal that handles most of Kazakhstan’s crude exports. The perpetrators remain unconfirmed.
The strikes on Western‑operated tankers followed the U.S. seizure of a Russian‑flagged vessel in the Atlantic last week, increasing the risk that more oil supplies could be drawn into the conflict.
And those supplies could be enormous. Combined oil exports from Venezuela, Iran and the Black Sea reached 4.6 million barrels per day in 2025 – about 4.5% of global supplies. While energy markets have become less quick to price in geopolitical risk in recent years, this is a figure traders simply cannot ignore.
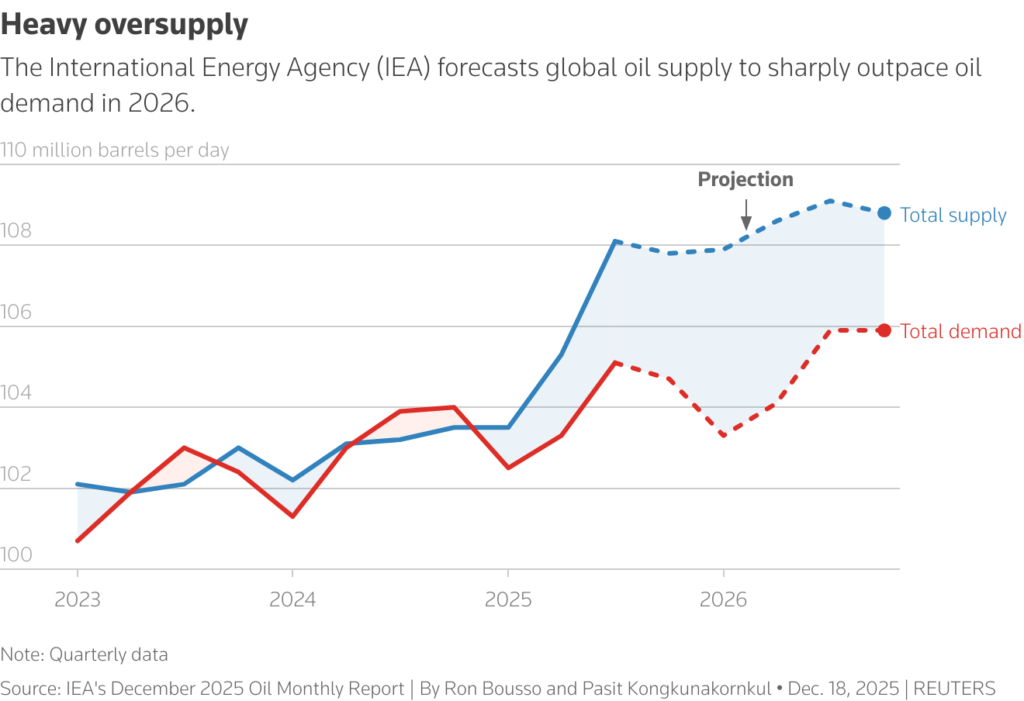
This chart depicts the global oil supply and demand between Q1 2023 and Q3 2025, and their forecasts between Q4 2025 to Q4 2026.
BACK TO HORMUZ
Among all these geopolitical risks, the biggest remains Iran, and more specifically the potential for the conflict to threaten flows through the Strait of Hormuz, the narrow waterway near Iran through which nearly 20% of global oil and gas is shipped.
Tehran is unlikely to jump to this “nuclear option”, however, as doing so would cut off its own crude exports and would likely trigger a rapid response from the U.S. and regional states. That was probably the regime’s calculus during last year’s 12‑day Israel‑Iran war.
Still, Iran has other options, such as targeting regional U.S. allies. While Tehran’s strike on a U.S. base in Qatar in June was a non-event met by a drop in oil prices, a repeat now could have a very different impact on the market.


Remember that in 2019 an Iranian drone attack crippled Saudi Arabia’s Abqaiq processing facility, knocking out 5% of global supplies for several weeks and causing a sharp price spike.
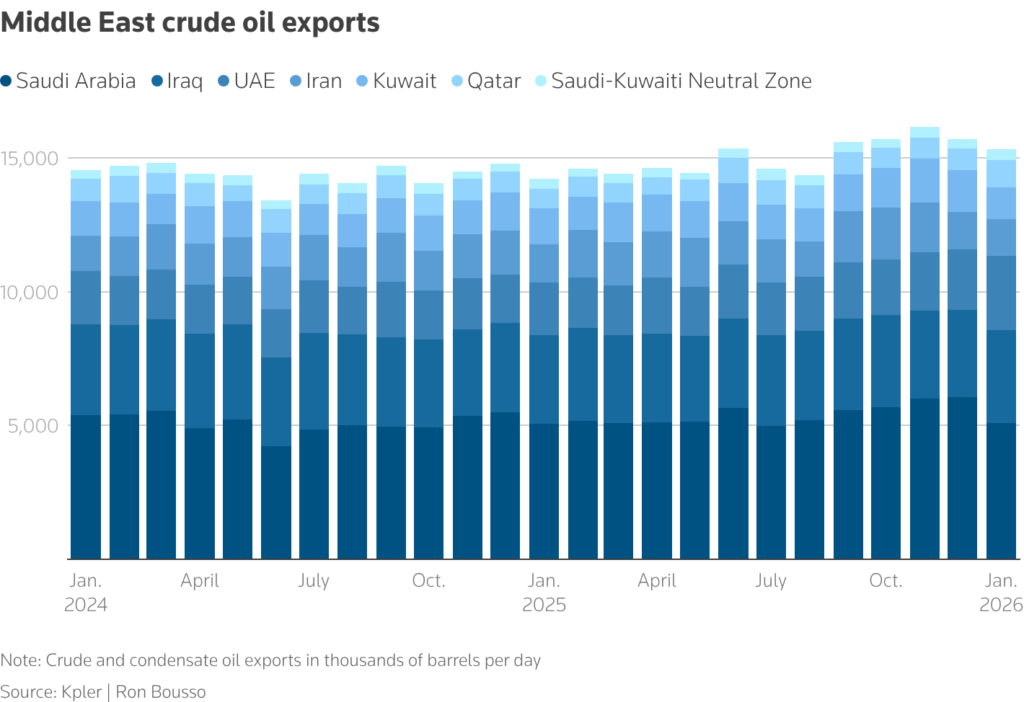
Middle East crude oil exports
FORGET THE GLUT?
While the 9% move over the past week is notable, crude prices still remain within the fairly narrow band they have traded in for months. So why hasn’t 2026’s burst of geopolitical tensions caused a more dramatic increase?
Primarily because it is coming just as global crude supplies appear to be rising sharply, threatening to outpace demand in the coming years. The U.S. Energy Information Administration expects global inventories to build by an average of 2.8 million barrels per day in 2026.
Indeed, the volume of oil being transported in tankers has risen significantly in recent months to around 1.3 billion barrels, the highest since mid-2020, when global consumption cratered due to COVID-19 lockdowns, according to analytics firm Kpler. So-called “oil on water” typically rises when supply is outstripping demand.
Of course, around one quarter of these volumes currently originate from Iran, Russia and Venezuela, meaning these are sanctioned supplies that would be expected to take longer to find buyers.
But the figure remains elevated regardless, and there are early signs of rising crude and product inventories on land as well.
To complicate the picture further, the oil price curve implies traders are not anticipating a significant build.
Prompt Brent crude prices have in recent weeks shifted into a structure known as backwardation, meaning they are trading at a premium to contracts for delivery toward the end of 2026.
Prompt prices need to be lower than future prices to make storage profitable, a structure known as contango.
The disconnect between the physical market and the price curve likely reflects the persistent visibility issues into the so-called “shadow fleet” of tankers transporting large volumes of sanctioned oil as well as China’s opaque storage.
But on top of that, traders must now also speculate about the potential outcomes of complex, rapidly evolving political situations in three key oil‑exporting regions – and then determine the likely impact on supplies.
Investors thus face a bewildering range of possible outcomes, meaning prices will likely remain rangebound until at least some of the questions hanging over markets are answered.
Ron Bousso; Editing by Marguerita Choy
Share This:


