


 CDN NEWS |
  US NEWS


LITTLETON, Colorado, Jan 15 (Reuters) – Despite all the policy whiplash – or perhaps because of it – the U.S. energy system has started 2026 with more buzz and momentum than seen in decades.
At home, electricity production is growing far faster than in most western peers, which is allowing utilities to deliver more power to the fast-growing and energy-intensive data centres and AI applications that are key drivers of the U.S. economy.
Overseas, the U.S. is set to cement its position as the largest and most influential exporter of crude oil and natural gas, which continue to underpin a vast majority of global energy systems and generate massive earnings for the U.S. Treasury.
The robust state of the U.S. energy sector makes good on U.S. President Donald Trump’s “energy dominance” push, which looks set to gather even more momentum this year as further supportive energy policy measures are rolled out.
Below are the main metrics on electricity generation and fossil fuel production and exports to help track the state of the U.S. energy sector through 2026 and beyond.
ELECTRIC GROWTH
Total U.S. electricity generation by utilities climbed by 3% in 2025 from the year before, which marks the second straight year that wholesale electricity output posted a 3% or better rise, data from Ember showed.
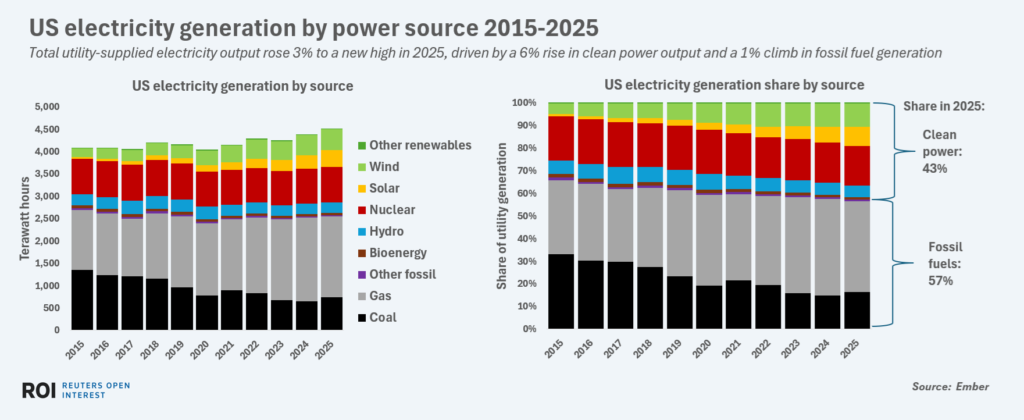
Total utility-supplied electricity output rose 3% to a new high in 2025, driven by a 6% rise in clean power output and a 1% climb in fossil fuel generation
That electricity supply growth rate compares to an annual average of 0.3% during the previous five years, and so clearly reveals that utilities have stepped up generation efforts.
The lift in total utility generation resulted from a 5% annual increase in electricity output from clean power supplies, and a 1% rise in output from fossil fuel power plants.
The United States’ 3% expansion rate in total utility supplies compares with just a 0.2% rise last year in total utility electricity generation in Europe, which remains gripped by an economic slowdown due in part to stubbornly high energy costs.
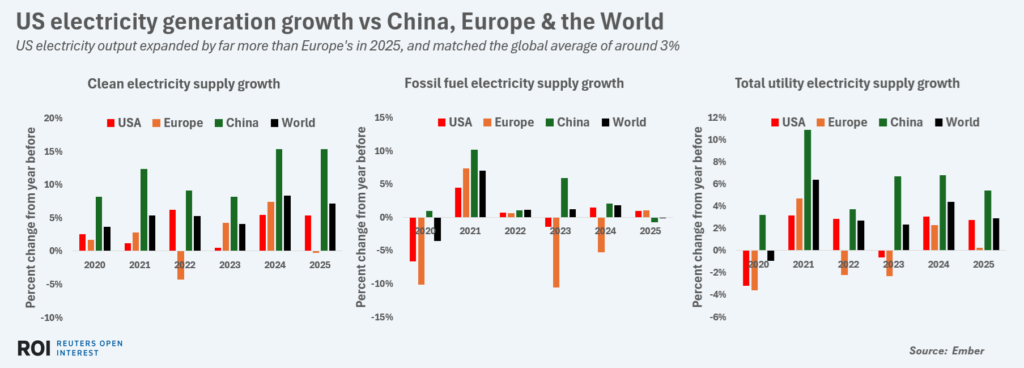
US electricity output expanded by far more than Europe’s in 2025, and matched the global average of around 3%
The U.S. growth rate matches the global average in 2025, but lags the 5% rise in utility electricity output posted by China.
In 2026, U.S. utilities are expected to lift electricity generation to new heights, thanks mainly to scheduled additions to solar and battery networks as well as the planned restart of the Palisades nuclear plant in Michigan.
However, scrapped federal support for renewable energy projects will slow the pace of new solar and wind capacity additions and may drag on the electricity output growth rate over the medium term.
OIL, GAS & COAL
While clean power sources gained a record share of the U.S. electricity mix in 2025, fossil fuels remain the primary pillar of the U.S. energy system and account for around 83% of total U.S. energy supplies, according to the Energy Institute.
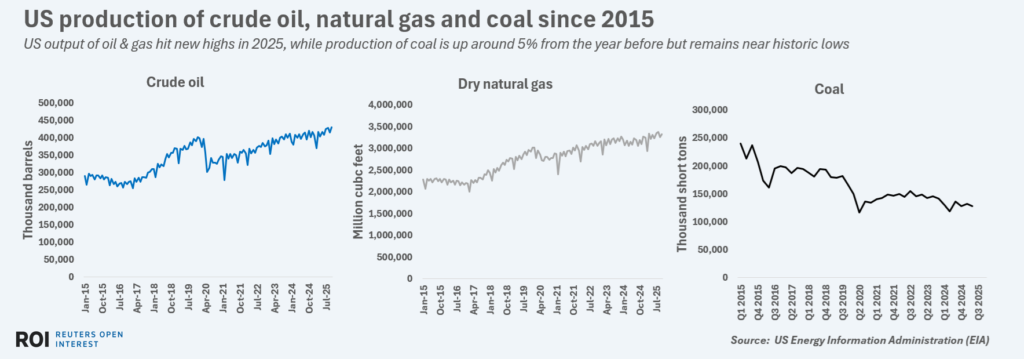


US output of oil & gas hit new highs in 2025, while production of coal is up around 5% from the year before but remains near historic lows
Record production of both crude oil and natural gas in 2025 has helped fossil fuels maintain that heavy share of the energy supply mix.
U.S. crude oil output averaged 13.6 million barrels per day in 2025, according to the U.S. Energy Information Administration (EIA), while dry natural gas production averaged 107.4 billion cubic feet per day.
The output of coal also increased in 2025 – by around 5% from the year before – but total U.S. coal production remains well below the levels of a decade ago due to reduced use in the domestic power generation system.
Natural gas remains the primary power fuel in the U.S., and accounts for around 40% of electricity production and is also a major power and heating source for industry.
Rising natural gas prices – driven by rising power use as well as record demand from LNG exporters – are expected to lift extraction rates from gas wells in 2026, especially in low-cost basins in close proximity to liquefied natural gas export hubs.
FOSSIL EXPORTS
LNG was the star of the U.S. energy export arena in 2025, with a record 252 million cubic meters shipped out, according to commodities intelligence firm Kpler.
Total LNG exports in 2025 jumped by 25% from the year before, and are poised for additional growth in 2026 as new liquefaction capacity comes online along the Texas and Louisiana coasts.
The EIA has estimated that total U.S. LNG exports could climb by 9% in 2026 to 1.3 billion cubic feet per day (Bcf/d) and will then rise to 1.7 Bcf/d in 2027.
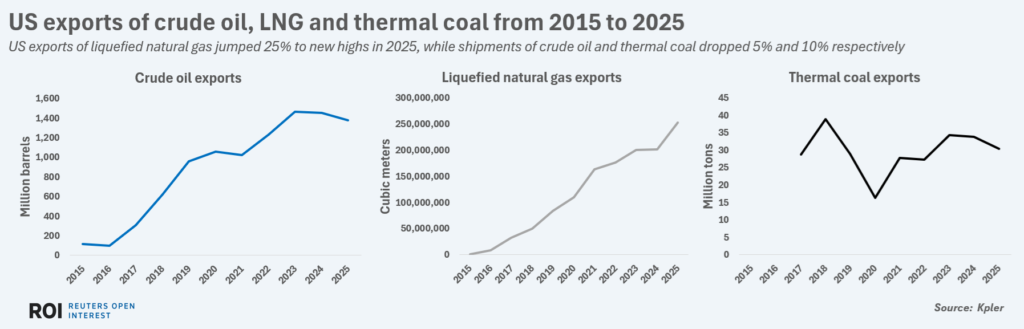
US exports of liquefied natural gas jumped 25% to new highs in 2025, while shipments of crude oil and thermal coal dropped 5% and 10% respectively
The trajectory of U.S. crude oil exports in 2026 is less clear.
On the one hand, robust output combined with fairly flat domestic crude consumption suggests exporters will have ample supplies.
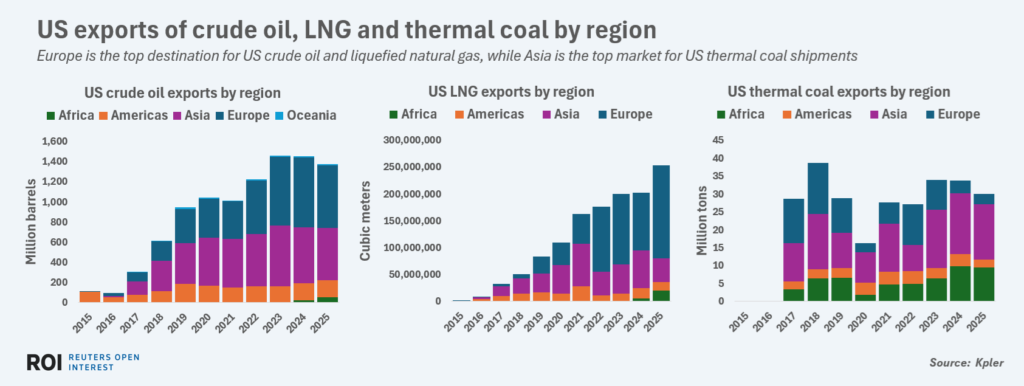
Europe is the top destination for US crude oil and liquefied natural gas, while Asia is the top market for US thermal coal shipments
However, whether exporters will be able to ship out more than the 1.38 billion barrels they exported in 2025, according to Kpler, remains to be seen, as they will have to contend with higher supplies out of Venezuela following the U.S. ouster of Venezuelan President Maduro earlier this month.
U.S. exports of coal are also under pressure from declining global demand for the fuel and elevated competition from Indonesia, Australia, Colombia, Russia and South Africa, which all enjoy shorter trade routes to major importers.
That said, U.S. President Trump’s strong support for the coal industry is expected to yield higher coal output and use by the power sector in 2026, so even if coal exports remain flat overall, coal output and use look primed for growth in 2026.
Alongside the expected continued growth in LNG exports, near-record output and exports of crude oil and record power sector output, the overall state of the U.S. energy sector looks set for another strong year in 2026.
The opinions expressed here are those of the author, a columnist for Reuters.
Share This:


