


 CDN NEWS |
  US NEWS


LITTLETON, Colorado, Aug 21 (Reuters) – U.S. power generation capacity is evolving at the fastest pace in decades, as utilities scramble to ensure that supplies keep up with rapidly growing electricity demand from data centers, AI applications, businesses, homes and electric vehicles.
To help frame expectations on what power sources will likely be in play over the coming years, the U.S. Energy Information Administration (EIA) issues decade-out projections on generation capacity of the top power sources within the U.S. energy system.
Those projections frequently change, and will be especially likely to alter course following the aggressive changes to U.S. government policy on renewable energy since U.S. President Donald Trump returned to office.
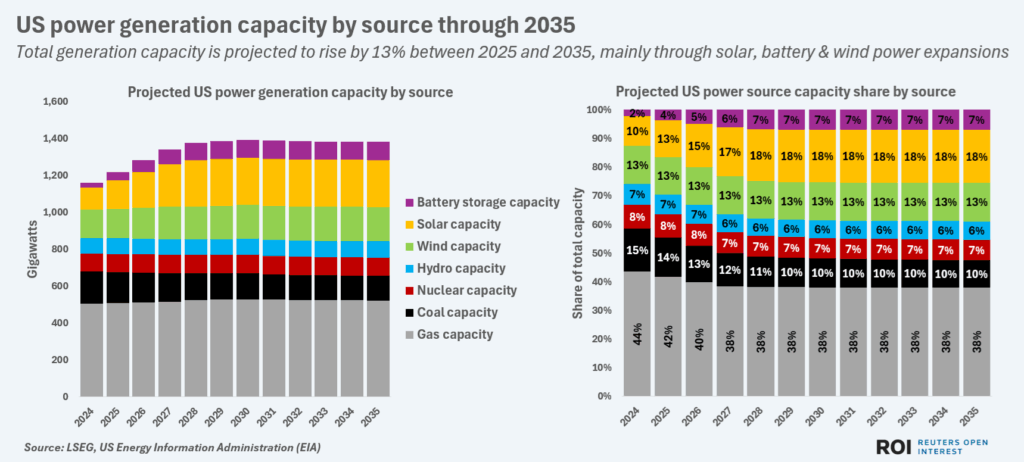
US power generation capacity by source through 2035
Even so, it is instructive to lay out current expectations for the U.S. power generation mix through the next 10 years, and then compare future actual capacity additions to those projections over time.
GAS CRUTCH
Even before the Trump administration slashed support for solar and wind power development, the EIA projected that natural gas would remain the primary power source within the U.S. power system for at least another decade.
Indeed, total projected gas-fired power capacity was expected to grow by 3% over the next decade to 523.3 gigawatts (GW) by the end of 2035, EIA data shows.
Given the pressure that utilities are under to urgently boost power supplies just as incentives to develop clean power are stripped away, it is likely that the actual capacity growth for U.S. gas power will be higher.
Even so, due to the much faster growth rate of clean power sources over the remainder of 2025 at least, gas is set to lose some ground within the overall U.S. power mix going forward.
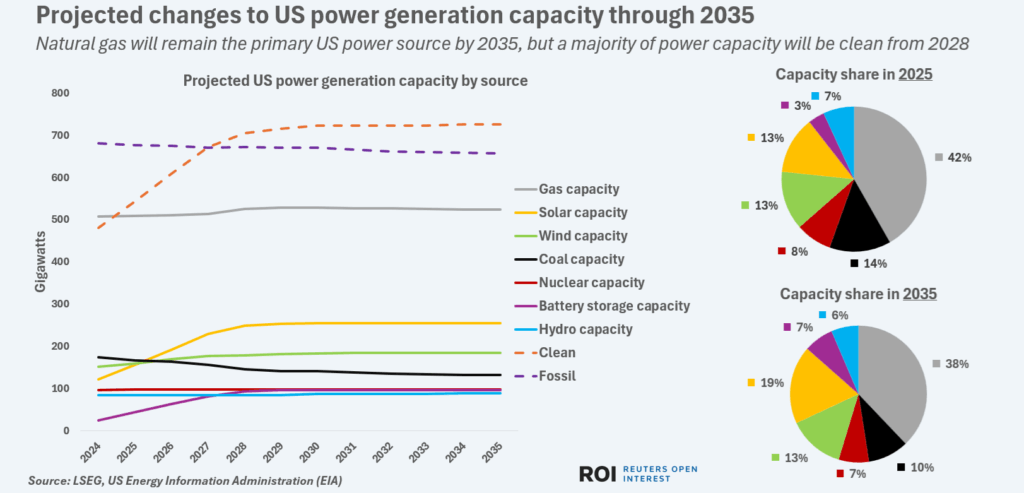
Projected changes to US power generation capacity through 2035
In 2025, gas-fired power accounts for around 42% of the overall power mix. That share is set to drop to around 38% by 2028, and then remain steady through 2035.
Coal’s share of the generation mix is set for a much steeper decline, from around 14% currently to 10% by the end of the decade.
Total coal capacity is expected to shrink from around 167 GW currently to around 133 GW by 2035 as outdated plants close.
Nuclear reactors and hydroelectric power stations are also set to lose generation share, from around 8% and 7% respectively right now to around 7% and 6% respectively by 2035.
Total installed capacity of nuclear power within the U.S. generation mix is currently around 98.4 GW, and is expected to hold largely flat for the coming decade.
Hydropower capacity is also slow moving, and is expected to increase only slightly from the current 84.2 GW by 2035.
CLEANING UP
EIA projects that solar, wind and battery storage systems will expand their respective generation shares notably by 2035, due to their currently much-faster growth rates.
In 2025, both solar and wind power are estimated to have a roughly 13% share of the current generation mix.
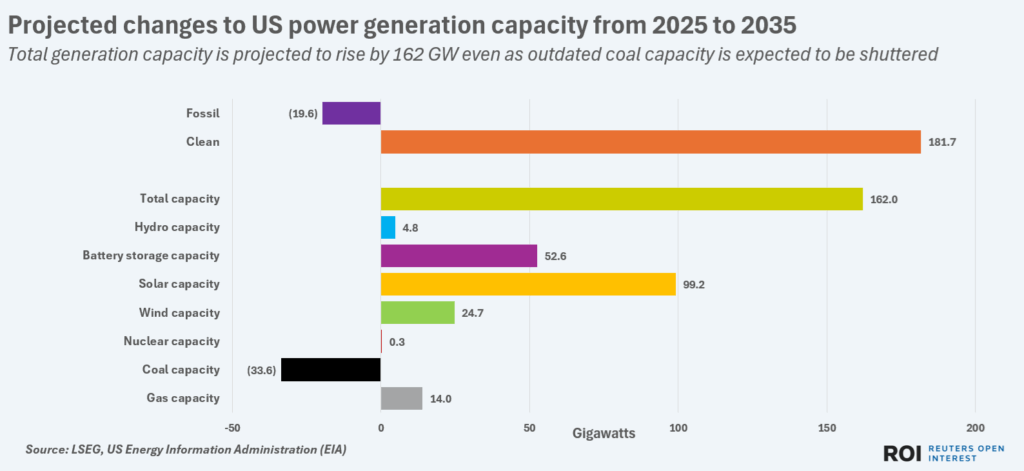
Projected changes to US power generation capacity from 2025 to 2035


By 2028, however, solar farms are projected to account for an 18% share of the pie thanks to a combination of lower cost and quicker ramp up times compared to other generation options.
Total utility-scale solar generation capacity is projected to rise from around 156 GW currently to around 255 GW, or by 64%, by 2035, EIA data shows.
In contrast, wind farm capacity is expected to grow more slowly due to high component costs, limited expansion area and greatly diminished policy support in Washington, DC.
Total wind capacity is currently estimated around 160 GW, and will rise by 15% or by 25 GW to 185 GW by 2035.
Battery storage capacity is expected to outgrow all other parts of the power mix, with the current capacity of around 45 GW set to more than double to around 97.2 GW by 2035.
Rapidly declining battery costs plus enduring policy support for batteries in utility systems are expected to sustain battery uptake even as the momentum of solar and wind power systems drops down a gear or two.
REGIONAL TRENDS
The scale of changes to projected capacity vary significantly by region, with the Southwest and Western U.S. expected to see the largest increases in overall generation capacity by 2035.
The Western half of the U.S. is also projected to be home to the largest overall increases in solar and battery capacity, due to the greater solar radiation and higher amounts of suitable land for solar farms and battery networks in those regions.
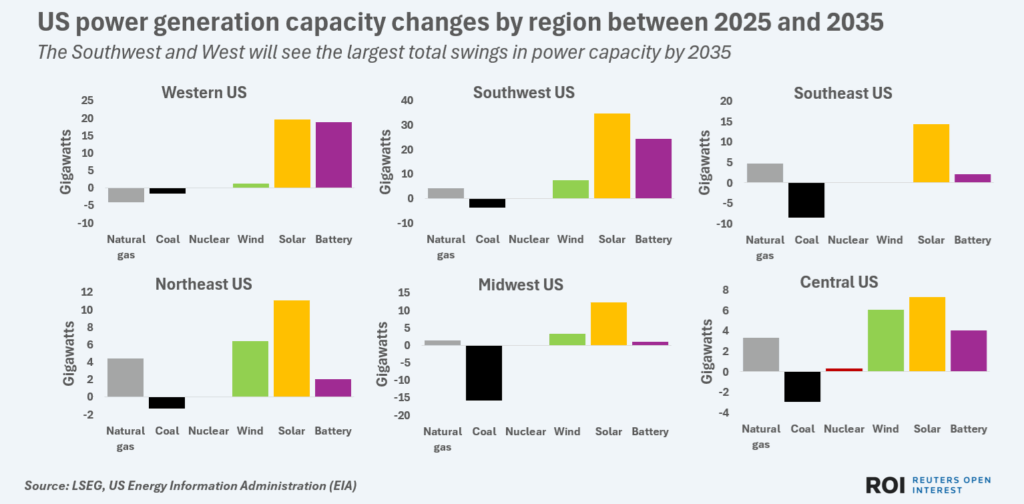
US power generation capacity changes by region between 2025 and 2035
Around 55% of total solar capacity growth and 82% of battery capacity growth are projected to take place in the Southwest and Western U.S., EIA data shows.
In contrast, around two-thirds of the projected increase in gas-fired power capacity is expected to occur in the Eastern half of the country.
Just over 9 GW of the 14 GW of total projected new gas capacity is expected to be constructed in the Southeast and Northeast areas.
Given the sharp cuts to incentives to add renewable power beyond 2025, utilities in the Southwest are also likely to dial up their gas capacity over the coming decade, especially if demand for data centers and air conditioning continues to grow.
Coal capacity is currently projected to decline in all regions by 2035.
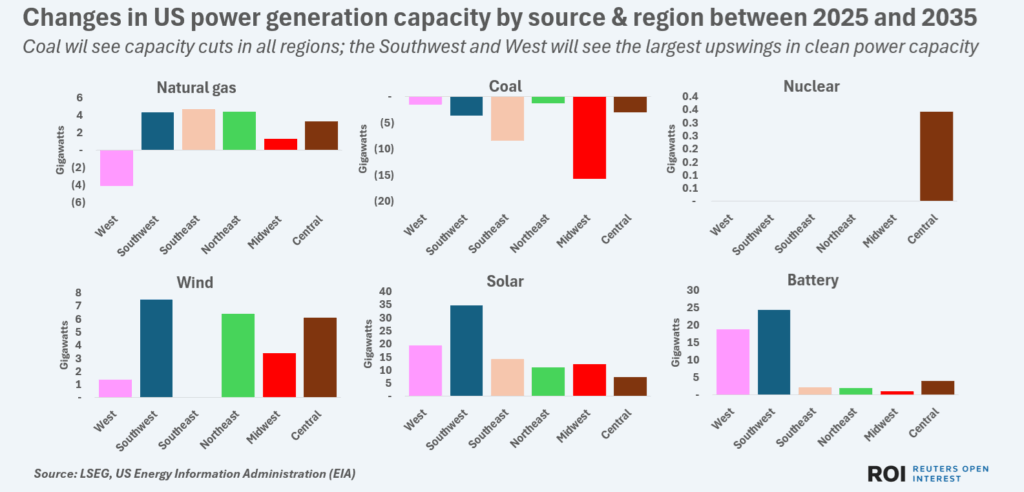
Changes in US power generation capacity by source & region between 2025 and 2035
But given the support for coal from the current administration, as well as the growing strain on power grids due to rising electricity demand, it is likely that some of the projected coal plant shutdowns will be postponed.
That will likely result in coal maintaining a larger share of the U.S. generation mix a decade from now than currently projected.
Gas’s share of the U.S. mix is also more likely to overshoot than undershoot projections, especially given the anti-renewables stance of current policymakers which may steer more utilities to add gas over solar or wind.
Even so, it is clear that overall capacity development momentum remains in favour of clean energy, especially solar and battery systems, and their continued growth looks certain in the years ahead even as federal policy support phases out.
The opinions expressed here are those of the author, a columnist for Reuters.
Reporting by Gavin Maguire; Editing by Diane Craft
Share This:


