


 CDN NEWS |
  US NEWS


The recently released 2022 Power Transition Trends report by energy research firm BloombergNEF shows signs of profound change under way in the sector. Wind and solar now make up 11% of global power generation. Of the new power-generation capacity added in 2021, solar was 50% and wind was 25%.
At the same time, thanks to economic rebounds from the worst of the Covid-19 pandemic, last year also saw an unprecedented spike in coal-fired power generation. It was up 750 terawatt-hours from 2020 — a very big number, in between the annual power consumption of Brazil and Japan, the world’s 6th- and 5th-biggest national electricity consumers. The power sector’s carbon dioxide emissions also rose 7% year-on-year.
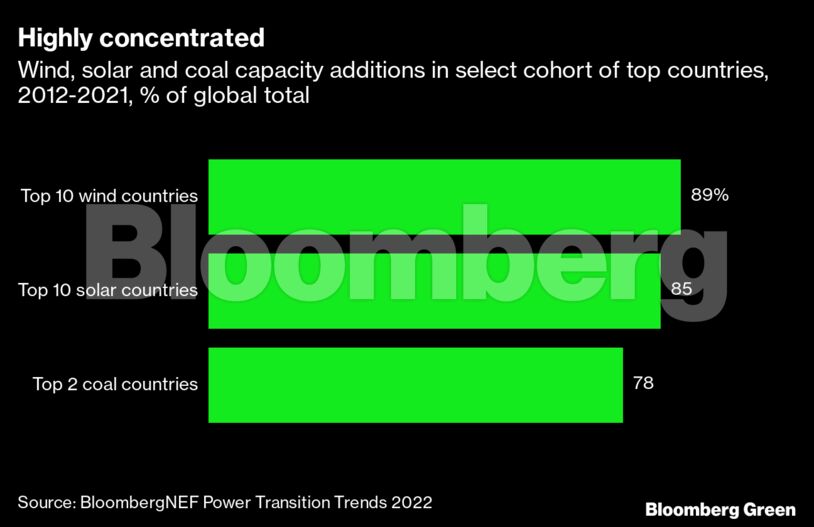
Wind is the most highly concentrated. From 2012 to 2021, the top 10 markets for wind power accounted for 89% of all new capacity installed in that time. Solar is only slightly more diffuse, with the top 10 markets in the same period getting 85% of all installations. China, the US, Japan and India were the biggest solar markets during that time; China, the US, India and Germanry were the biggest for wind.
And then there is coal. Just two markets — China and India — made up a combined 78% of all new coal-fired power generation capacity in the past 10 years. China on its own had 62% of total installations, with 414 gigawatts. India is the only other market with even 100 gigawatts installed. Vietnam and Indonesia, which each had 21 gigawatts built from 2012 to 2021, run a very distant third.
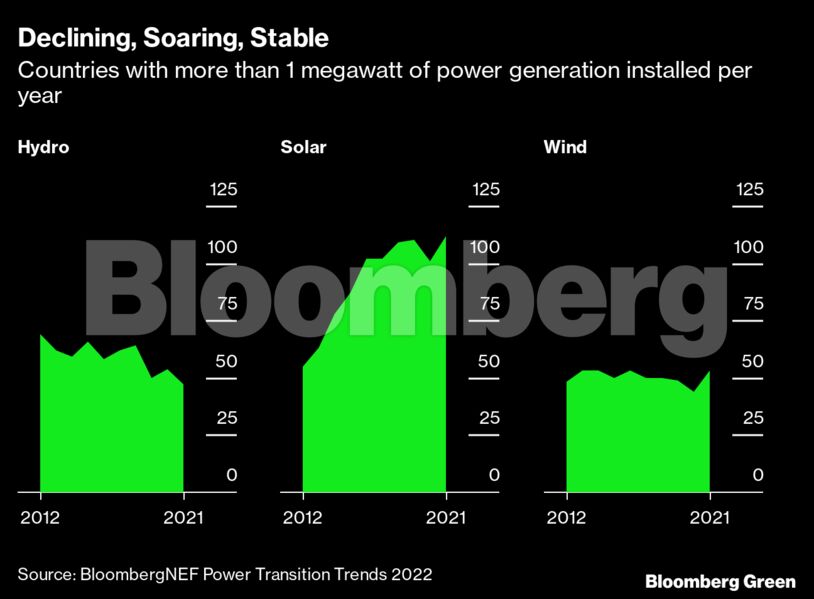
Another way to look at trends is by the number of countries where assets are being developed at commercial volume (which BloombergNEF classifies as greater than 1 megawatt of construction in a year).
In 2012, more countries were adding hydroelectricity than either solar or wind at commercial scale. Almost 70 countries built hydro in 2012; 55 built solar; and 48 built wind. Ten years on, hydro has shrunk to 47 countries; solar has more than doubled to 112, and wind is more or less the same, now being built in 53 countries.


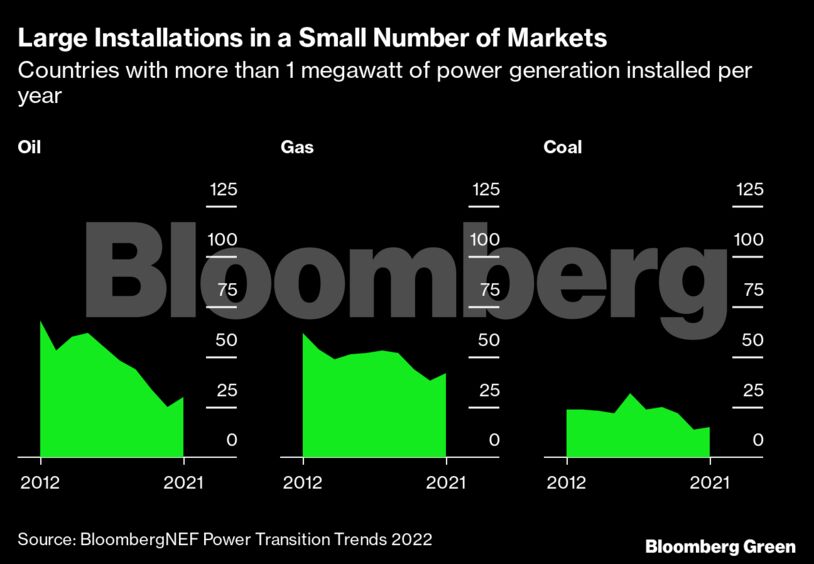
Market activity for the three fossil fuel-fired technologies — oil, natural gas and coal — is shrinking. In 2012, there were almost 70 countries building oil-fired power, more than 60 adding gas, and 24 building coal. A decade later, oil-fired power expansion shrank to 30 countries, gas-fired power to 42 and coal-fired power to just 15. Coal is a global climate problem; its expansion is also concentrated in a very few places.
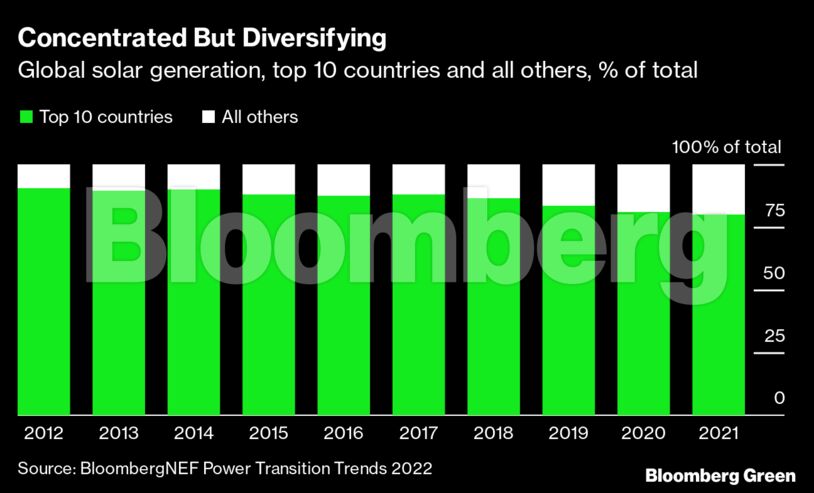
One trend worth noting relates to solar’s total market expansion. While development of projects is still highly concentrated, solar generation — the power produced by what has already been built — is becoming less so over time. In 2012, 10 countries generated 90% of all solar power, whereas last year, it was 80%.
This is certainly a good thing for solar power and the countries building it. Diversifying markets, with a wider distribution of local benefits such as reduced emissions and a buffer against variable fuel costs, is a solar feature.
It is also worth exploring why the number of active wind markets has expanded little since 2012. One reason is simply a matter of methodology. A 1 megawatt solar project — the threshold to be included in this BNEF report — has thousands of individual panels but is quite small. A single megawatt can be deployed on a roof, a fallow field or a small island.
Conversely, for wind, there basically is no such thing as a 1 megawatt project using today’s utility-scale turbines. One megawatt is a fraction of the capacity of a single turbine, with some new offshore ones under development having as much as 14 megawatts of capacity. To put it another way, solar scales downward in a handy way for reaching small markets; wind scales up to reach big ones.
Given their different scales, it is a testament to wind power that it continues to create new markets. That means it is competitive on cost in more and more places, and also that the industrial expertise needed for its heavy engineering is diffusing as well.
As for solar, it just keeps on going: more markets, at greater scale. This year, solar installations are likely to hit 250 gigawatts and add a quarter to all capacity installed to date.
Nat Bullard is a senior contributor to BloombergNEF and Bloomberg Green. He is a venture partner at Voyager, an early-stage climate technology investor.
Share This:


