


 CDN NEWS |
  US NEWS


Recent news headlines have been dominated by ominous economic trends – led by reports that in December U.S. inflation rose at its fastest 12-month pace in nearly 40 years. Economists generally say that inflation occurs when too many dollars are chasing too few goods and/or services.
Energy is part of the current inflationary trend. API’s chief economist, Dr. Dean Foreman, has been saying for months that rising demand for crude oil – the leading fuel for the U.S. and world economies – was outpacing supply, and that this demand/supply mismatch had placed upward pressure on prices. For example, the spot price of West Texas Intermediate crude oil was $86.24 per barrel as of Jan. 21 – up by 63.7% y/y including 12.9% in the first three weeks of 2022. The prices of other crude oil grades on the global market have similarly risen.
Unfortunately, policymakers haven’t necessarily been called to action by official forecasts – with one that projected a market surplus and lower oil prices this year and in 2023 and another that projects declining gasoline and diesel retail prices. Every forecast is just a view, subject to uncertain assumptions. As we’ve begun 2022 with oil at its highest levels since 2014 and global natural gas at unprecedented highs at more than $30 per million Btu, a key question is whether projections that the supplies of oil and natural gas could outpace their demand this year will occur. In the Q&A below, Foreman addresses questions about inflation, energy prices, the U.S. industry’s response to increasing demand and the importance to all Americans of having a strong natural gas and oil sector.
Q: What causes inflation and are corporations contributing, as some have asserted?
A: By economic fundamentals, scarcity is the name of the game. If something’s in demand, but its supply is limited, people generally compete and pay more for things they need and want. As economies around the world expand their money supplies – by printing money or through the expansion of credit – much of this liquidity competes for virtually everything including goods, services and every variety of assets, and prices have historically and generally risen in response, other things being equal.
As we’ve noted, the underlying drivers of broad price inflation (in the context of post-pandemic economic recovery) mainly concern money and credit competing for relatively scarce goods, services and other assets – none of which relates to corporate profits.
To be clear, the economic motivation to earn a profit is foundational to America’s economic system. In the energy industry, the price increases we’ve seen this past year are textbook examples of what happens when demand responds faster than supply, as has been the case across many industries through the recovery from the pandemic.
In fact, if we compare the consensus estimates of corporate profits per dollar of sales (“operating margins”) across sectors, they suggest that the S&P 500 energy sector (10 cents on the dollar) is below average compared with overall S&P 500 index (13 cents per dollar) and less than the following sectors: Communications (17 cents per dollar), Real Estate (18 cents per dollar), Financials (19 cents per dollar), and Information Technology (25 cents per dollar). So, as fundamental as energy is the economy, many other sectors have contributed to the current reality.
Q: What role has energy played with inflation?
A: Energy costs contribute to price inflation. Energy currently receives 7.5% weight in the Bureau of Labor Statistics’ (BLS) estimates of consumer price inflation, but its impacts are greater since energy is so fundamental to economic activity.
Importantly, while price inflation is measured as a matter of degree, consumer household budgets are a matter of difference. That is, as prices go up, consumers make hard choices and/or take on debt to make ends meet. However, at some juncture there are prices that can affect consumer sentiment as well as break points that put household budgets under stress.
For example, when U.S. gasoline prices per gallon receded below $2 per gallon in April 2020, that helped household budgets go further. Consumers felt and were wealthier as a result, and some took advantage of historically low fuel prices to drive more at a time during the pandemic when air travel was less attractive.
By contrast, when U.S. gasoline prices peaked at $4.11 per gallon in mid-July 2008 before the Great Financial Crisis and the U.S. energy revolution (equivalent to $5.30 per gallon in 2022 constant dollars), exceeding the $4-per-gallon threshold was an attention-grabber for many households back then, the kind that could induce them to drive less or buy a more fuel-efficient vehicle.
Q: How have Biden administration energy policies had impact?


A: Administration energy policies – such as canceling pipeline infrastructure, pausing new federal leasing for months and making its resumption more arduous, considering targeted tax increases on the natural gas and oil industry, proposing a clean energy power plan that could virtually eliminate natural gas in U.S. electricity generation, have not helped foster the flow of investments into domestic production at a time when domestic production has remained down compared with its levels in late 2019 and early 2020.
To be clear, the administration has had a domestic solution available to help keep downward pressure on energy prices, but instead did and said things that didn’t support production at home, choosing to ask OPEC to increase OPEC’s output. On top of the ongoing issues with work force shortages and supply chain and financial challenges in the wake of the 2020 COVID-19 recession, these administration energy policies have made it even harder to make long-lived investments in domestic natural gas and oil development.
Q: As energy companies report earnings, what should Americans know – with crude oil at current price levels?
A: Earnings by companies – energy and otherwise – add value to the economy and are engines of employment, economic growth and innovation.
Historically, energy has been among the 11 fundamental sectors of the economy included in major stock market indexes like the S&P 500 – sectors such as industrials, utilities, telecommunications and more. In fact, in 2021, energy outperformed the other sectors in the S&P 500.
What this means is virtually every American who saves for retirement and has investments in broad indexes, including mutual funds, likely owns shares in U.S. energy companies – again, historically, solid sources of dividend income.
Criticism of energy company earnings misses the fact that millions of American savers, investors and retirees broadly benefit when energy companies perform well financially. It also misses the point that energy company earnings, in part, fund new investment, new development and new production that help keep the economy growing and strengthen U.S. energy security.
Q: Is American production catching up to help address the demand/supply mismatch that has driven energy costs?
Not exactly. First, U.S. production ranged between 11.3 million barrels per day (mb/d) and 11.7 mb/d throughout the fourth quarter of 2021 as well as the first half of January 2022, according to EIA. U.S. drilling activity has remained down by 20% or more compared with the same point in 2019, and about one-third of U.S. oil and natural gas well completions in 2021 came from previously drilled but uncompleted wells, so-called DUCs, by EIA estimates. This is how U.S. production has remained flat despite historically low drilling activity, but it could be a harder act to repeat in 2022 because the inventory of DUCs is less per EIA. Drilling activity picked up in early 2022, Baker Hughes reports, but it will likely take investment and drilling levels much more like those of 2019 to return the U.S. and the world to or above 2019 production levels. We’re not close to that just yet.

Q: What about official projections that 2022 supply will grow and ease price pressures?
A: An appropriate interpretation of any energy projection is to say, this is what could happen if the key factors leading to the supply/demand balance hold true. When we look at EIA’s Short-Term Energy Outlook, it suggests that global oil demand eclipsed 101 mb/d in December, exceeding its level from December 2019, and could grow to more than 103 mb/d by December 2023. At the same time, however, EIA suggests that production could respond even more strongly, as shown by the following chart:
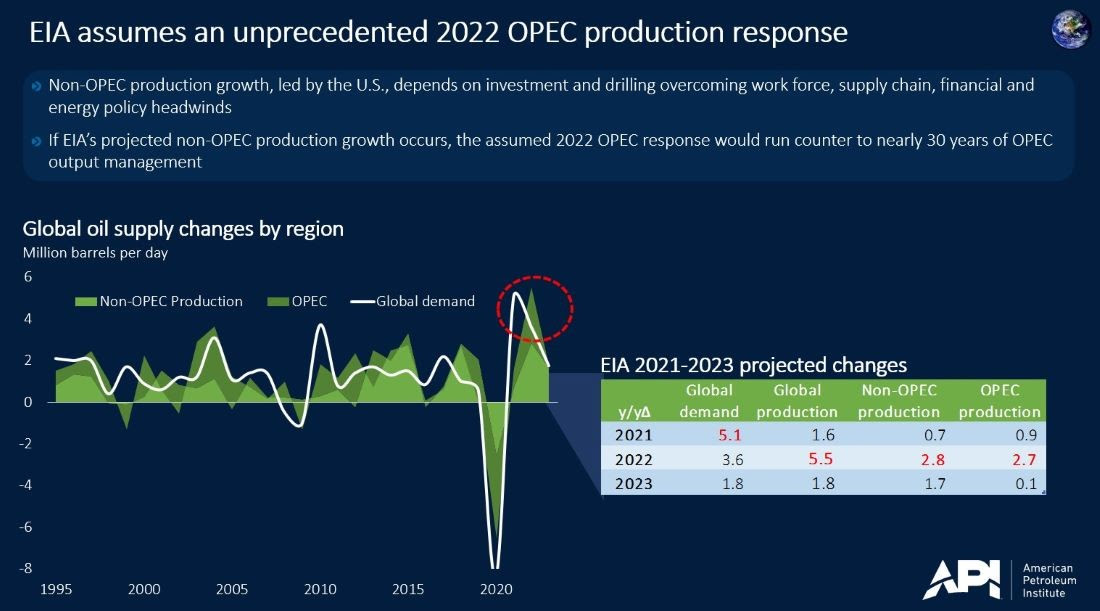
EIA doesn’t publish its assumptions about drilling rig activity, and one uncertainty is whether U.S. petroleum liquids production could achieve growth of 1.2 mb/d on average in 2022, contributing to non-OPEC supply growth of 2.8 mb/d – compared with global demand growth of 3.6 mb/d for the year.
About The Author
Mark Green joined API after a career in newspaper journalism, including 16 years as national editorial writer for The Oklahoman in the paper’s Washington bureau. Previously, Mark was a reporter, copy editor and sports editor at an assortment of newspapers. He earned his journalism degree from the University of Oklahoma and master’s in journalism and public affairs from American University. He and his wife Pamela have two grown children and six grandchildren.
Share This:


