


 CDN NEWS |
  US NEWS


By Nathaniel Bullard

Oil has a lower return on equity than renewables
For years, oil companies enjoyed a very high return on equity, which they returned in part to shareholders through share appreciation and dividends. But today, oil company ROEs have fallen to the point that they are lower than what BloombergNEF expects from newly built renewable power generation assets. In our latest levelized cost of electricity (LCOE) analysis, the global benchmark return on equity for offshore wind is 11%; for onshore wind, 9%; for photovoltaic solar, 8%.

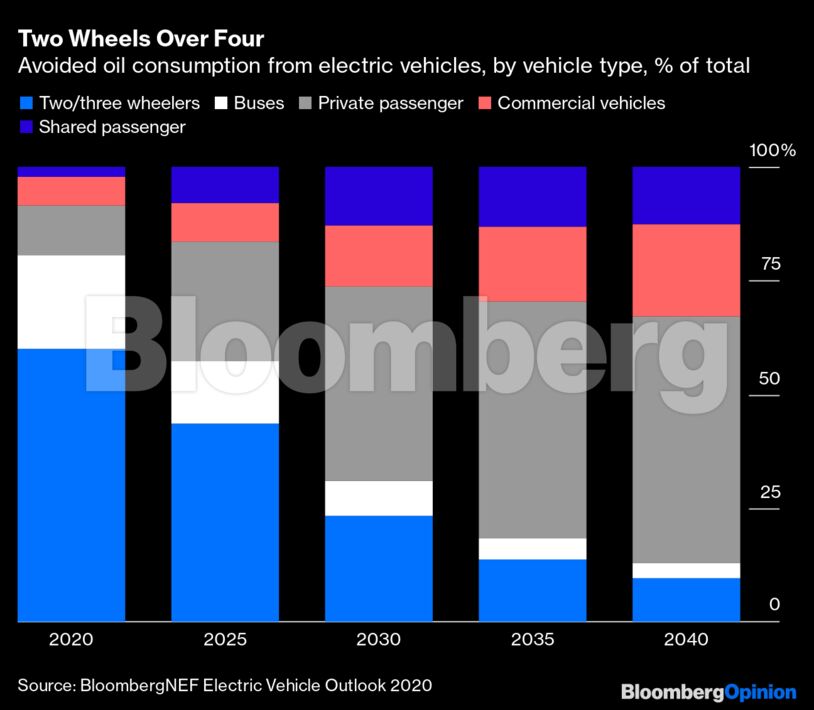
Not all electric vehicles are cars
In May, BloombergNEF analysis found that the electric vehicles currently on the road are already avoiding a million barrels per day of the world’s would-be oil consumption. There are now millions of personal electric vehicles on the road and hundreds of thousands of electric buses, not to mention commercial electric vehicles. Yet none of those categories is the main part of avoided oil consumption today. For that we can thank the tiny electrics with two or three wheels — they’re responsible for more than half of that vanished demand for oil. There are almost a quarter-billion such electric vehicles on the road today. China buys more than 18 million electric two-wheelers a year; by 2040, BNEF expects the world to buy 70 million.
Electric vehicle sales are outperforming
Global automobile sales plunged in the first two quarters of 2020 to levels not seen since the financial crisis. Electric vehicles, though, fell less. That’s thanks to Europe, which had the largest fall in internal combustion sales (down almost 56% year on year) and a similarly humongous increase in EV sales (up more than 45%). Expect the electric vehicle market to grow in 2020.

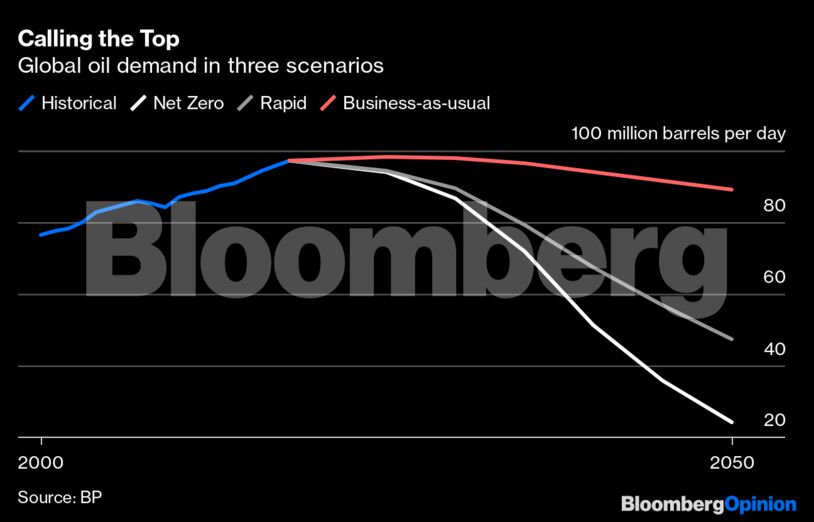
BP calls the top on oil demand
The big takeaway from BP Plc’s annual energy outlook: Oil demand will peak this decade. That’s not because of aggressive policies aimed at reaching net-zero global greenhouse gas emissions by 2050, nor as a result of carbon prices or other interventions aimed at limiting global temperature rise. BP says that even if energy policy keeps evolving at pretty much the pace it is today, oil demand will still start declining.
Fossil fuel emissions have probably peaked


Carbon dioxide emissions from fuels burned for power, transportation, industry and building-related applications probably peaked in 2019. Power emissions from natural gas likely did too. Power sector emissions — the largest single component of fuel combustion emissions today — probably topped out earlier, in 2018. That’s also true of emissions from coal-fired power, still the single largest component of global power generation. Coal and gas will continue to shrink, each ending up at 11-12% of total power generation by 2050. Solar, though, will be nearly double that, and wind even more.

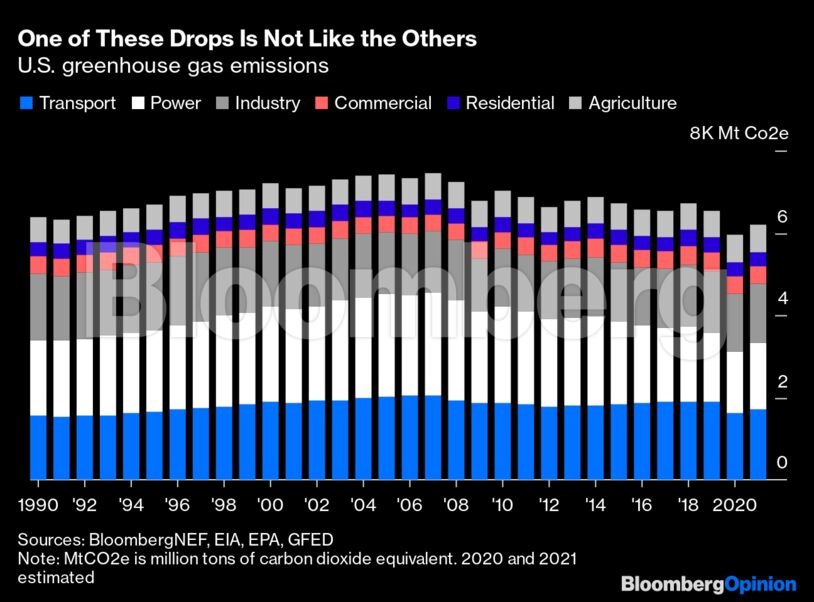
U.S. greenhouse gas emissions drop more than 9%
U.S. greenhouse gas emissions have been trending downwards for the past 12 years, thanks to a power sector transforming through more gas, less coal, more renewable generation and greater efficiency. The pandemic also had an impact: BloombergNEF finds that 2020’s emissions are on track to be 9.2% lower than in 2019. That’s the biggest drop on record. U.S. greenhouse gas emissions haven’t been so low since 1983, when the U.S. economy wasn’t quite 40% of its current size. Emissions are likely to rebound next year, but will still be lower than any year since 1990.
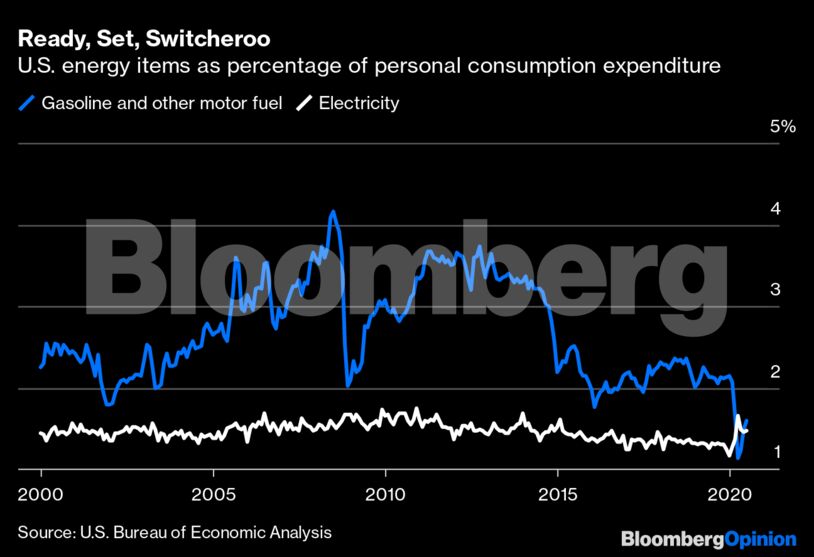
Electricity tops gasoline in the American pocketbook
The Covid-19 pandemic has upended conventional wisdom in oil markets (prices will never go negative) and car sales (electric vehicle sales will fall off a cliff). At the end of the summer, it sideswiped another decades-old trend, at least in the U.S. For the first time since at least 1960, U.S. personal spending on electricity was higher than it was on gasoline. Will it happen again? It could, with more people working at home and a major shift to electric personal transport (and a transfer of spending from gas and diesel into electricity).
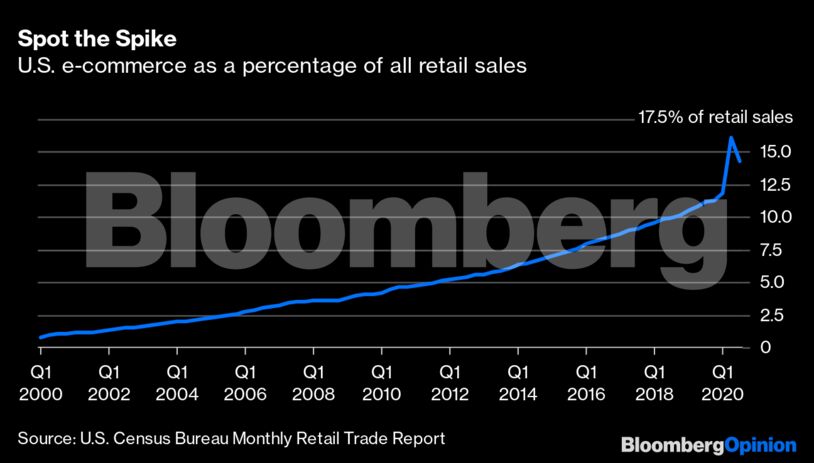
E-commerce need not be a climate disaster
Since it first showed up more than two decades ago, e-commerce has slowly eaten its way into the global retail landscape a few fractions of a percentage point at a time. Covid-19 took this trend and lit a fire under it, sending U.S. e-commerce from 11.3% of all U.S. retail at the end of 2019 up to 16.1% at the end of the second quarter of 2020. It took more than seven years for e-commerce to expand from 5% to 10% of total retail sales; Covid-19 produced that same growth in six months. It needn’t be a climate disaster though, thanks to relentless efficiency efforts in data centers, planned electric delivery vehicles, net-zero greenhouse gas emissions commitments, and the sort of thinking (like avoiding left turns) that is always optimizing for lower consumption.
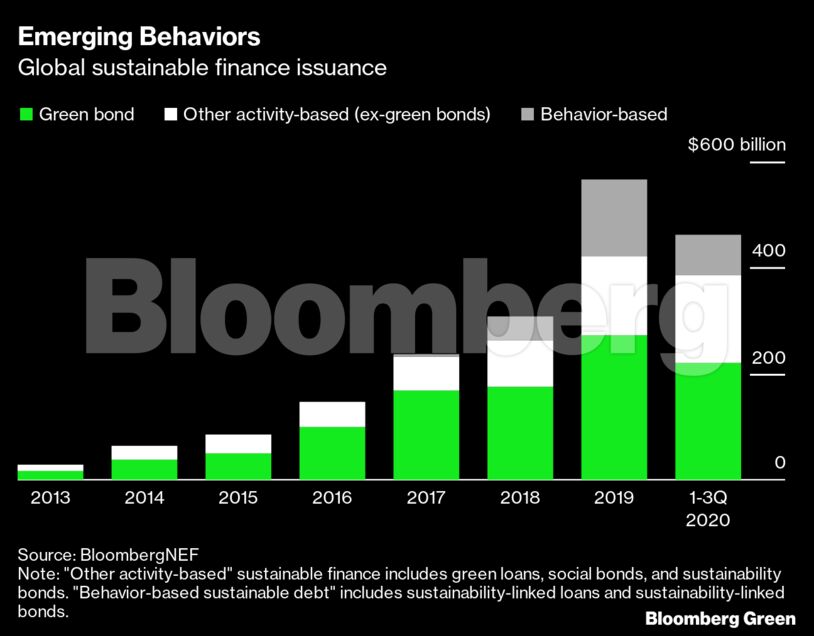
The first trillion is the hardest
We’ve passed a major milestone in sustainable finance: one trillion dollars in issuance of green bonds. BloombergNEF sorts sustainable finance into two buckets: “activity-based” and “behavior-based.” Activity-based sustainable debt issuers use the funds on sustainable projects such as a wind farm, an energy efficiency retrofit or emissions reduction. Behavior-based sustainable debt, on the other hand, is tied to issuers’ sustainability targets. There’s more work to do, but with all due respect to Drake and the late T. Boone Pickens, in debt markets, the first trillion is the hardest.
Share This:


