By Zumao Chen and Dave Dewees
Computational fluid dynamics (CFD) modeling can be used as an efficient and low-cost alternative to improve the design and operation of a new burner. There are many factors that affect the performance of burners in a charge heater in a refinery. The burner needs to maintain a certain heat flux profile for heat transfer to the heater tubes. A field test is often conducted to evaluate the heat flux profile when a new burner is designed, or a burner is operated under conditions different from the design conditions [1]. However, it is impractical for field tests to evaluate many scenarios that involve different hardware options or operating condition changes. CFD modeling can be used to screen design options and operating conditions to find most promising arrangements; it is cheaper and has a much faster turnaround, compared to field tests. In addition, a CFD model provides detailed performance predictions that cannot be obtained from field tests [2].
In the following example, a computational fluid dynamics (CFD) study is carried out to investigate the combustion characteristics, flame attachment and radiant section heat flux distribution in a charge heater. The model consists of the detailed configuration of the burner, including the gas spuds, the central gas nozzle, the pilot and the turning vanes in the windbox. Individual tubes in the radiation section are included in the model to predict the fireside tube surface temperature and heat flux. The tube banks in the convection section are modeled as porous media with global calculations of heat transfer and pressure drop.
The realizable k-e model is used to model the turbulent flow in the charge heater. The gaseous fluid is assumed to be a compressible ideal gas. Radiation in the heater is simulated with the discrete-ordinates (DO) model. A mass conservation equation is solved for each gas species. The oxidation of hydrocarbons is assumed to follow two steps [3]. In the first step, the hydrocarbons are oxidized to form carbon monoxide and water vapor; this step is typically kinetically fast. In the second step, carbon monoxide is further oxidized to form carbon dioxide; this step is kinetically much slower than the first step [4]. The oxidation rates of the hydrocarbons are calculated based on the finite-rate/eddy-dissipation model in which the reaction rate is taken to be the minimum of the kinetic rate and the turbulent mixing rate.
The modeling conditions are based on the average operating conditions of the heater. The fuel gas is fed to the gas spuds and the central gas nozzle. The natural gas is introduced to the burner through the pilot. Air is provided to the windbox inlets.
Figure 1 shows the iso-surfaces of the gas temperature at 2500°F. The burner flame is predicted to be attached and stable. The flame length is approximately 17 ft based on a gas temperature of 2500°F.

Figure 1: Iso-Surfaces of Gas Temperature
Figure 2 shows the oxygen concentration distributions on different planes. The oxygen concentration is relatively uniform in the region above the mid-height of the radiation section of the heater, which indicates adequate mixing between the fuels and the air in the heater, leading to complete combustion of the fuels and CO burnout.

Figure 2: Oxygen Concentration Distributions
The heat flux distribution on the tubes in the radiation section of the heater is presented in Figure 3. The fireside local heat flux as a function of the heater height is also provided in this figure for two tubes. The maximum heat flux occurs at about 18 ft above the heater floor.

Figure 3: Heat Flux Distribution in Radiation Section
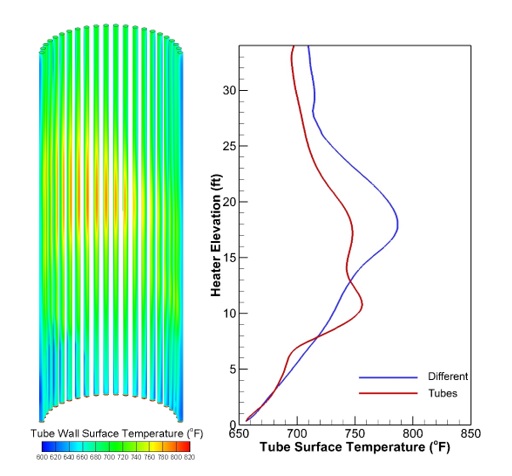
Figure 4 shows the distribution of the tube surface temperature. The figure also shows the local tube temperature on the external surfaces of two tubes along the heater height. The temperature profile for each tube is very similar to the profile of the heat flux for the tube.
The results presented in Figures 3 and 4 can be utilized to identify the locations of high tube temperatures, and to find potential problems associated with the heater operation. If the local tube temperatures are found to be higher than the safe tube metal temperature, the operating conditions, such as the spud orientation or firing rate, can be adjusted to obtain a desired flame length or heat flux profile to reduce tube temperatures. In addition, the combustion efficiency can be evaluated based on the distributions of gas species concentrations in the heater and the average gas concentrations at the heater exit. The combustion efficiency can be improved by comparing different operating conditions to find optimal conditions for the heater.
Figure 4: Tube Wall Surface Temperature
Learn more at becht.com
References
[1] G. Theis, J. McAdams and A. Gueniche, Using biofuel gas under O2 enriched flue gases in steam crackers, presented at IFRF 2018.
[2] Z. Chen, A.N. Sayre, R.A. Wessel and D.K. McDonald, CFD modeling of oxy-fuel combustion in a coal-fired utility boiler, 25th Annual International Pittsburgh Coal Conference, Pittsburgh, PA, September 29 – October 2, 2008.
[3] C.K. Westbrook and F.L. Dryer, Simplified reaction mechanisms for the oxidation of hydrocarbon fuels in flames, Combustion Science and Technology, 27, 31-43, 1981.
[4] J.B. Howard, G.C. Williams and D.H. Fine, Kinetics of carbon monoxide oxidation in post-flame gases, 14th Symposium (International) on Combustion, The Combustion Institute, Pittsburgh, 975-986, 1974.
Share This:


 CDN NEWS |
  US NEWS


