


 CDN NEWS |
  US NEWS


January 26, 2018, by Nikos Tsafos
It has been two years since the United States began to export liquefied natural gas (LNG) from the Lower 48, and this might be an opportune time to ask, what have we learned so far? Such an exercise comes with many caveats, of course. The ramp-up in U.S. LNG is just beginning, after all: the country exported less than 13 million tons of LNG in 2017, a fraction of the ~66 million tons of annual capacity that it will have once all projects now under construction are completed—something unlikely to happen before 2020.
Yet U.S. LNG came with plenty of expectations both in the United States and overseas, and the public dialogue makes a number of claims and assertions surrounding U.S. LNG. These assertions are worth testing now that we have some data and some hindsight.
What Did We Expect?
In 2010, when Cheniere Energy first proposed to export LNG, the country was still in import mode. Two facilities to import LNG were actually still under construction, and others were planned. The prospect of exporting LNG raised many questions, the most important of which was whether to allow exports at all; and if exports were to be allowed, how much should be exported, under what terms, and to whom?
A consensus soon emerged that LNG exports would bring more benefits than costs. They would support a continued expansion in domestic gas production, and the resource base was ample enough to support that build out, while any rise in prices would be modest and was unlikely to hurt American consumers and industry. The international benefits were harder to quantify but included that U.S. LNG would help Europe lessen its reliance on Russia; that it would lower gas prices globally and boost gas use, a fuel with a lower carbon footprint than oil or coal; and that U.S. LNG could help create a more liquid and transparent LNG market—similar, one day, to today’s oil market.
What Has Happened Domestically?
LNG exports are a small but growing share of the U.S. gas market: 0.7 percent of marketed gas production in 2016, and 2.3 percent in 2017 (through October). LNG exports supported gas demand in a year (2017) when demand from the power sector was weak (down 8 percent through October); industrial gas use, by contrast, is at its highest point since 2001, showing there is little tension so far between domestic industry and exports. At the same time, LNG provided less demand support than pipeline exports, which were four times greater in 2017 (through October).
As for gas prices, Henry Hub rose in 2017 relative to 2016, but most of the increase came in early and mid-2016. Since then prices have been stable, with some volatility; prices in December 2017 were similar to those in July 2016, even though LNG exports were much higher in late 2017 than in 2016. It is hard to say what role LNG has played, but most analysts expected LNG to have a modest impact on U.S. gas prices, especially at these levels, and this is borne out by the facts so far.
What Has Been the Impact on Global Gas Prices?
U.S. LNG gained traction largely because it promised to be cheaper than other LNG suppliers. But a lot has changed since August 2012 when the first LNG project from the Lower 48 was given the go-ahead to begin construction. At the time, Brent was $113 per barrel, and Japan was importing LNG for $18 per million British thermal units (MMBtu). In that environment, U.S. LNG was seen a bargain, even though everyone understood that prices could turn, and the wide arbitrage could shrink or even turn negative.
Now that arbitrage has shrunk—largely due to the decline in oil prices to which most gas prices are linked, especially in Asia. In fact, the growth in U.S. oil production has done more to weaken the commercial case for U.S. LNG exports than any other factor, by lowering oil-linked gas prices and narrowing the gap between U.S. and Asian prices. In November 2017, for instance, Japan paid $8/MMBtu for LNG; thus the $8.40/MMBtu it paid for U.S. LNG seemed hardly compelling at all.
A few other price expectations have been unfulfilled so far as well. Most analysts look at the supposed cost of U.S. LNG: how much does the gas cost; how much does it cost to liquefy it; and how much to ship it to the end market. They then compare that cost to other LNG prices. But that is not how LNG works: cost and price are two different things. In July 2017, to pick an extreme example, U.S. LNG arrived in South Korea for ~$9/MMBtu, but it reached nearby Japan for ~$13/MMBtu. Similar spreads are seen in Europe: cargos have arrived at the same time in nearby markets at prices that have varied by 50 percent or more. Now, these differences are typical in gas and LNG, but they confirm that U.S. LNG is likely to behave in ways similar to other LNG, rather than chart an entirely new path.
There is also no evidence, despite some hopes to the contrary, that Henry Hub is having a material influence on gas prices overseas. The correlation between Henry Hub and European hubs is no stronger today than in the past, which means that European pricing is still largely driven by other factors. The same is true in Asia, where most gas prices are still driven by oil. In the spot market, prices are still swayed by small changes in supply and demand. It is not clear that gas prices globally are tracking Henry Hub in any meaningful way.
Nor is there any evidence that the existing supply of U.S. LNG is putting any meaningful pressure on gas prices. Of course, the United States is still a small LNG exporter: it accounted for just over 4 percent of total supply in 2017. It was not even the main source of growth: according to IHS Markit, Australia exported an additional 11.7 million tons of LNG in 2017, versus an extra 9.8 million tons from the United States. This will change in time, but it means that what happened in global LNG in 2017 was only tangentially driven by the United States.
Even so, U.S. LNG is usually framed in terms of a global market that is oversupplied: preliminary figures from IHS Markit show that LNG supply rose by 11.2 percent in 2017; and more is coming. But gas prices show a more mixed picture. In major Asian importers, border prices rose by 15 to 20 percent in 2017 (largely tracking oil). In some European hubs, the increases were around 25 percent. In Latin America, LNG prices were more stable. So, U.S. LNG is exerting some pressure on prices, but there is no evidence yet that there is an LNG glut aided by U.S. LNG.
Has U.S. LNG Been as Transparent as We Hoped?
Besides lower prices, analysts hoped that the United States would introduce unprecedented transparency in this opaque market. In some ways, the United States has lived up to its promise. The Office of Fossil Energy at the U.S. Department of Energy produces a very useful report on LNG exports on a cargo-by-cargo basis—the type of report that one rarely finds among importers or exporters. It comes with a slight lag but is complete and comprehensive.
At the same time, the pricing information in that report is all over the place. Some prices include liquefaction fees, while others do not. In November 2017, for instance, there were nine unique prices for cargoes exported from Sabine Pass, and they ranged from $3.165 to $6.165/MMBtu, with lots of numbers in between. In part, this underscores the folly, described above, of making a lot of assumptions about what U.S. LNG should cost versus what it actually costs. Real prices tend to deviate from assumed prices.
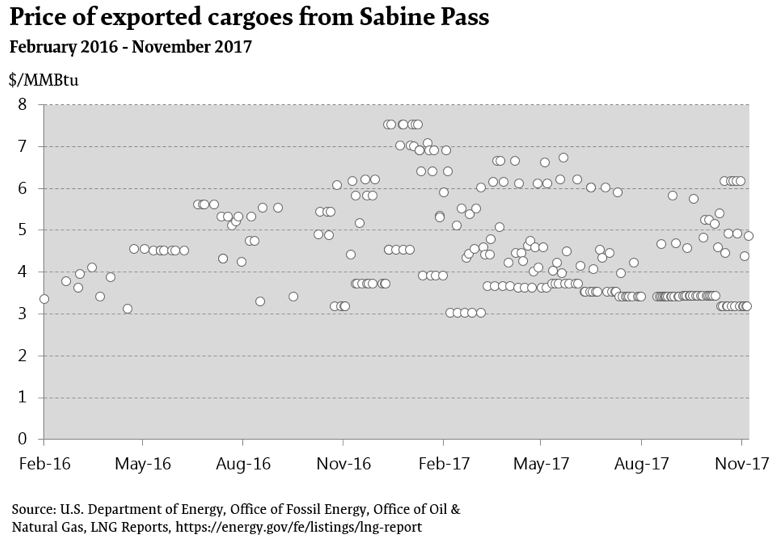
More fundamentally, it undermines a key promise that U.S. LNG held. There was an expectation that U.S. LNG exports would be priced in a clear and transparent manner. So far, all U.S. LNG has been exported from Sabine Pass based on export contracts in the public domain, with known pricing terms. And yet, it is already hard to understand what U.S. LNG prices represent and why they vary so much. Soon, new projects will come online, with pricing terms that are confidential. Even Cheniere Energy, which operates Sabine Pass, said it would not publish contract details for future deals (citing competitive concerns).
In other words, we will soon reach a point when pricing information will become unintelligible; we will have access to cargo-by-cargo pricing, but these prices will require a great deal of knowledge and expertise to dissect. Here too, it feels like the United States will look like every other LNG exporter rather than charting a new course toward more transparency.
Has U.S. LNG Been as Flexible as We Hoped?
The final area—besides lower prices and increased transparency, where analysts have hoped the United States would break new ground—was in flexibility. Contracts to purchase U.S. LNG have no destination restrictions, and buyers can resell them anywhere they wish. Some contracts also allow buyers to not purchase the gas at all, as long as they provide a fixed fee that covers the return on the investment for the infrastructure. This dual feature of U.S. LNG is usually seen as its most radical and transformative.
In some ways, this assessment is accurate. In Asia, for instance, destination clauses that restrict reselling are still the norm. So Asian buyers are particularly appreciative of the freedom of U.S. LNG. But there is also a tendency to caricature the LNG business as being dominated by inflexible, point-to-point contracts. Destination flexibility has been the norm in the Atlantic Basin for almost 20 years—LNG from Trinidad, Nigeria, Egypt, Equatorial Guinea, Norway, and Algeria has formed the basis for a burgeoning spot market for LNG. Even LNG in the Middle East has some flexibility, from Qatar, Oman, and Yemen (while it still exported LNG).
Understanding this broader context is essential if we are to appreciate what U.S. LNG brings. For instance, by 2016, more than a quarter of the world’s LNG was traded in the short-term or spot market—clearly, the world was not waiting around on the United States to develop a spot market for LNG. At the same time, that spot market has been largely flat since 2011, and as a share of total volume, it has shrunk, including in 2016 when the United States started to export gas. This is largely because the market lost some volumes with destination flexibility from countries that exported less or not at all (e.g., Trinidad, Egypt, Yemen).
The United States will thus add flexible volumes, but this assumed growth in liquidity is just that—an assumption. Whether the spot market grows will depend both on what happens to other sources of flexible supply, as well as on how U.S. LNG is marketed. So far, U.S. LNG by vessel has reached 25 countries (to November 2017), with Mexico, Korea, and China being the top three destinations by volume. But these three countries alone accounted for almost 50 percent of the total volumes exported, suggesting a greater geographic concentration than might be implied by saying U.S. LNG has reached 25 countries.
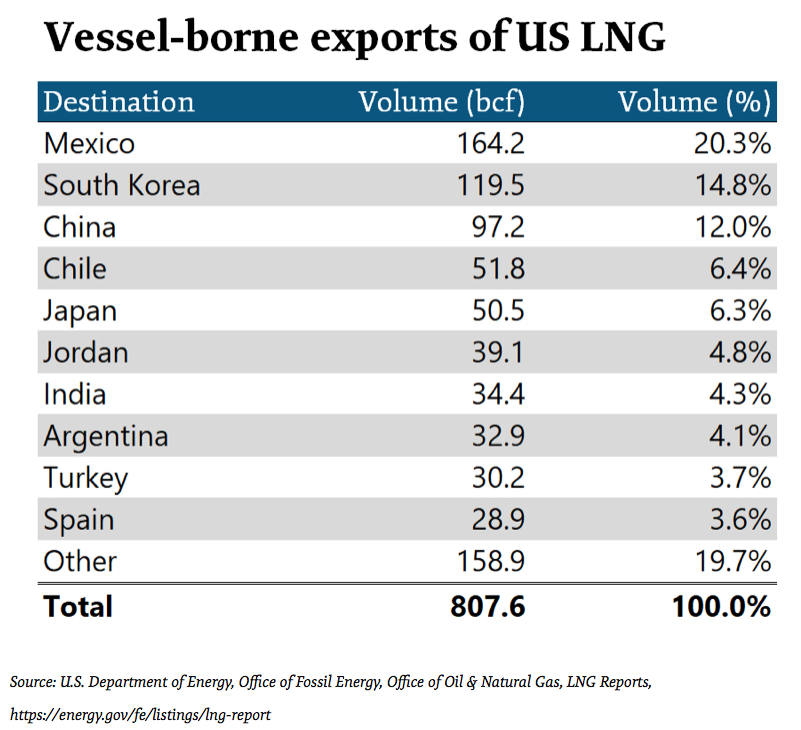
A few comments are worth making vis-à-vis these markets. First, Asia received just over a third of the total—which is low in terms of what the market might have expected, but also high in terms of what might be possible if there were more swaps. Second, Europe has received less, though each cargo that reaches Europe does so with great fanfare. Realistically, this does not matter much. What matters is how much LNG might or does reach Europe—not whether it comes from the United States. Third, China has been a major buyer, which is reassuring. The major Chinese LNG buyers did not sign long-term contracts nor did they invest in U.S. projects; they chosen to purchase their U.S. LNG through intermediaries. So far, this strategy has supported a vibrant trade between the two countries.
As we look forward, however, we still do not know how U.S. LNG will be marketed. Companies are still tweaking their plans. KOGAS, from Korea, has resold some of its volumes from Sabine Pass to France’s TOTAL. Centrica from the United Kingdom signed a deal to supply some of its U.S. LNG to PGNiG of Poland. Cheniere Energy just signed a contract to supply much of its own LNG to Trafigura, a trader. And GAIL of India was reportedly looking to issue a tender to sell some of its U.S. LNG in 2019–2020.
In other words, we have some flexibility on paper, but we do not really know how this flexibility will play out in practice or over time, especially when market conditions change and companies try different ways to sell their contracted supplies. Nor do we know what will happen if the arbitrage window shrinks and buyers start looking to renegotiate their contracts (as GAIL is reportedly keen to do).
Conclusions
It is thus too early to discern the full impact that U.S. LNG will have globally. But there was a vibrant debate in the LNG industry about whether the United States would impact LNG purely through its scale, similar to what Australia is doing, or whether it would force a more fundamental change, as Qatar did when it added great liquidity to the market as well as the ability to arbitrage between the Atlantic and Pacific Basins.
So far, the United States looks and feels like other flexible LNG suppliers—lots of different destinations but some major destination markets; prices that are all over the place, with above average transparency but with increasingly limited legibility; and marketing strategies that seem marginally more flexible at the moment, but which have yet to be tested in different market realities.
Nikos Tsafos is a senior associate with the Energy and National Security Program at the Center for Strategic and International Studies in Washington, D.C.
Commentary is produced by the Center for Strategic and International Studies (CSIS), a private, tax-exempt institution focusing on international public policy issues. Its research is nonpartisan and nonproprietary. CSIS does not take specific policy positions. Accordingly, all views, positions, and conclusions expressed in this publication should be understood to be solely those of the author(s).
Share This:


