M&A is one strategy for continued growth in the energy industry, especially when the market goes into increased volatility. The second half of 2020 was interesting as we saw more corporate deals than acreage deals, like the acquisitions of Parsley by Pioneer Resources and Concho Resources by ConocoPhillips in the U.S. and the Cenovus Energy-Husky Energy merger and the acquisition of Torc Oil and Gas by Whitecap Resources in Canada.
The driver of these corporate deals is the potential of economies of scale, where the new company identifies the best practices from each company and then implements them across the entire new organization.
In this article, we’ll discuss why digitalization and spend analytics are key to uncovering best practices and how to use data-driven decision-making to uncover these best practices to maximize cost savings within a new organization.
Step 1: Digitalization of back-office processes – a foundation for economies of scale
Digitalization of back-office processes lays the groundwork that creates the opportunity for economies of scale before, during and after an M&A situation. Why?
Because digitalization of processes does two things:
- It enables faster, more collaborative workflows between different stakeholders within a company, increasing operating efficiency. Examples include faster invoice cycles, faster spend visibility, reduced manual touchpoints with automatic invoice approvals, and more.
- It captures spend data that, when attributed and categorized properly, enables two companies to rationalize spend analysis across both organizations.
Choose the right solution
You need a single, unified digital platform to support the needs of these different stakeholders, including your suppliers. With a unified platform, you capture spend data and can rationalize spend across two companies that are involved in a merger or acquisition.
In an M&A scenario, you begin with two different spend teams with many of the same responsibilities, but different workflows, processes and allocation of dollars. A spend team includes procurement, operations, accounts payable and finance, and audit. They all evaluate the same spend, but they view it from different perspectives to deliver their respective value propositions to their business.
Even within a single organization, the silos that naturally arise from the different departments can make it seem like members of the same team are speaking entirely different languages. But these different perspectives are equally important for maximum business efficiency.
A unified platform breaks down these silos, allowing faster collaboration on workflows between these stakeholders – including suppliers – and providing a single source of accurate spend data so individual stakeholders can analyze and manage this data according to their role.
When evaluating process efficiency best practices between two merging companies,
if either uses a digital platform to manage its source to settle process, you can select performance metrics to identify bottlenecks and efficiencies in each company’s process and compare the two. These metrics will help you make an informed decision about which best practices to implement company-wide to drive economies of scale.
Step 2: Achieve holistic spend understanding
You also need more structured spend management and a better understanding of your supply chain. Spend analytics are critical for an optimized supply chain. Apples-to-apples price analysis and price benchmarking has traditionally been impossible because companies report the same transactions in completely different ways. Recognizing this as an industry-wide issue, Enverus normalized, categorized and attributed the $200 billion of spend data that flows through OpenInvoice to create OpenInsights.
Categorized, attributed data
- Categories — Using machine learning and algorithmic approaches and working with a team of about 150 analysts across our organization, Enverus divided goods and services into categories. These include, for example, proppant, pipes, valves, fittings and OCTG.
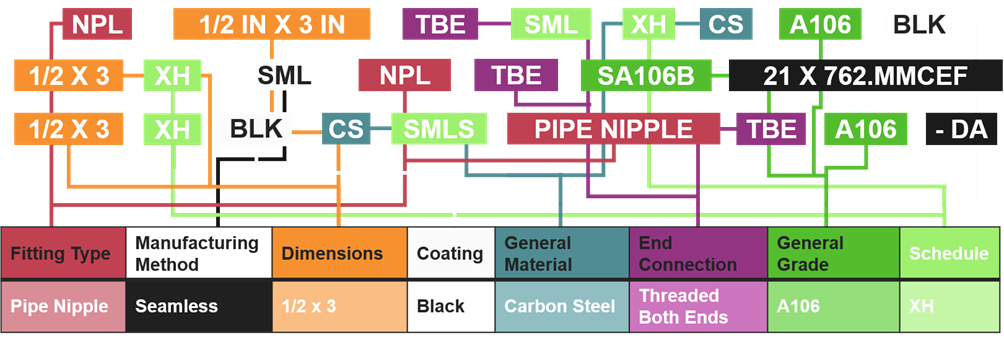
- Attributes — Products and services can’t simply be placed into single categories because there are several different characteristics within these categories. In OpenInsights, the categories are divided based on 40 million different attributes. This creates a much more usable and reliable data set. Here is an example of categorized and attributed pipe data.

Vendor consolidation
When two companies merge, the vendor network grows. Companies can use price analysis between suppliers to define preferred vendors. This example shows the distribution of price points for intermediate casing prices across four suppliers using three variables and how you can use spend analysis to find cost saving opportunities post-merger.

For intermediate casing, note that Supplier A and D sell at three different prices, Supplier C sells at two different prices, while Supplier B has the most consistent pricing. This information could be used to determine which vendor(s) should be preferred vendors or to lock down a single contracted rate for suppliers A and D rather than varied pricing.
Conclusion
As this low-price environment picks up, the industry will reorient itself with M&A to consolidate operations. Identifying and realizing economies of scale is almost impossible without a much more structured, individualized supply chain process in place.
Digitalization across your supply chain ecosystem allows for leveraging spend analytics to compare your spend to the rest of the market, driving decision-making processes and identifying cost savings and strategies moving forward. Successful digitalization of processes across the spend team to serve their needs provides more successful M&A analysis and best practice evaluation.
To learn more about how Enverus Business Automation solutions can help your company fast-track your M&A growth strategy, fill out the form below to speak to an expert.
Share This:


 CDN NEWS |
  US NEWS


