


 CDN NEWS |
  US NEWS


![]()
Overview
In Part 1 of this blog series an overview of two basic extensions to our void growth based HTHA model was given. In this part, validation of through-wall damage predictions are provided by leveraging the unique and exceptionally detailed work presented in the Peng Lui PhD dissertation [1]. Validation is critical for any model, and while the Becht HTHA model has a well-established theoretical basis, it is still an approximation to an extremely complex problem. Therefore, the goal of this and the subsequent two blogs in this series is to present the most comprehensive and extensive validation known to date for HTHA characterization. With this basis, time-based Nelson Curves suitable for use by industry are presented in the closing part of the series.
Available Through-Wall Data
In Reference [1], Lui and co-workers characterize through-wall damage for five C-0.5Mo cases; four for ex-service material and one experimental case. The ex-service cases range from 22 to 29 years while the experiment represents about a 1500 hour exposure; the cases are summarized in Table 1.
Table 1: Through-Wall Damage Cases Presented in [1]
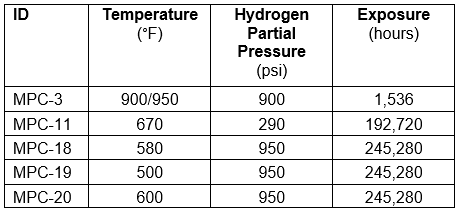
Note that MPC-18, 19 and 20 represent different locations in the same heat exchanger, and overall, there is good coverage of temperature and pressure within the range of interest. Detailed operating histories are not available for the ex-service cases (11 and 18/19/20) which does add uncertainty to the analysis, but as will be shown, very reasonable results are obtained for the conditions stated in [1].
Further Definition of Damage
While all of the cases given in Table 1 have through-wall damage characterized, particular focus was applied to MPC-18. For MPC-18 Liu presented two main indicators of damage:
- Fraction of grain boundary length attacked (FL)
- Charpy impact energy (CV)
The corresponding measured values for these quantities are shown overlaid on the actual wall cross-section macrograph in Figure 1. As shown, the impact energy appears to hit a lower shelf while the fraction of grain boundaries attacked is still increasing dramatically. Said another way, there appears to be a critical value of grain boundary attack at which properties are lost, even though grain boundary attack can and will still continue.

Figure 1: MPC-18 Through-Wall Damage Measures
With this in mind, the following definitions of damage are proposed:
Grain Boundary Length Attack-Based:
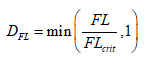
Property Loss-Based:
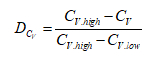
Property loss is the most relevant indicator for structural integrity, and the proposed CV-based damage is plotted in Figure 2 (again overlaid on the actual section macrograph). The damage measure matches the physically visible damage quite well, although unfortunately, through-wall measures of impact energy property loss are quite rare. At the same time microstructural level of attack is the more available indicator.
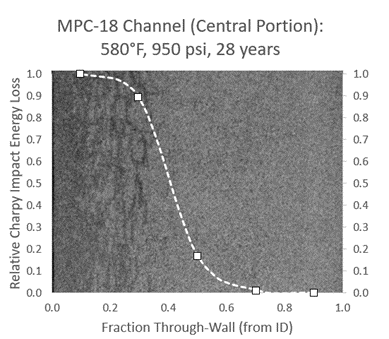
Figure 2: MPC-18 CV-Based Damage (Relative Impact Energy Loss)
With this in mind, Figure 3 shows the predicted grain boundary attack-based damage for three different critical fractions (e.g. FLcrit, the fraction where complete property loss is assumed to occur, capped at a maximum of 1 (100% damage)).

Figure 3: Effect of Critical Grain Boundary Fraction on Damage Prediction
As shown in the figure a value of 0.25 (or 25% of grain boundary length attacked) gives a very close match to the property-loss based damage measure such that model predicted damage can be related to either expected degree of grain boundary attack or property loss. Note that damage here is indexed to complete property degradation as opposed to start of property loss (or 50% loss, etc.). This does not mean that properties are unaffected below this value, for example, property loss may be present at as little as FL% = 5 – 10. Here the corresponding predicted damage and property loss would be predicted to be:
FL% = 5: D = 5/25 = 20%
FL% = 10: D = 10/25 = 40%
These values are likely quite conservative.
Model Extension to C-0.5Mo Steel
To test the model performance against the available through-wall cases, extension is needed to address C-0.5Mo materials. It’s well known that the behavior of C-0.5Mo steels has been extremely variable in practice, ranging from excellent to no better than plain carbon steel, which is illustrated in Figure 4.

Figure 4: C-0.5Mo API RP 941 and MPC Failure Points
The results in Figure 4 of course neglect time which is a critical factor (and removes significant scatter), but as will be shown in a subsequent blog, significant variability remains for C-0.5Mo material.
To extend the documented CS model to address C-0.5Mo, it is assumed that carbon activity (ac) can be used as a scaling parameter for performance. From a driving force perspective this is directly valid for methane fugacity (![]() ) [3]:
) [3]:
As shown in Table 2 (from [2]), carbon activity is directly related to the presence and stability of carbides in the steel. From a resistance standpoint, the assumption here is that carbide presence will also have a beneficial effect on the activation energies for diffusion and creep local to the voids. Separate scaling factors are used for diffusion and creep, but as an example, the creep activation energy in the model scales smoothly from the carbon steel value at ac =1 to commonly accepted values for 2.25Cr-1Mo at ac = 0.05.
Note that the assumption of a single scaling factor is just that; an assumption. It was tested against the available data, both for the MPC cases presented here and the much larger data set presented in a subsequent blog, and found to be quite effective, which is the actual justification for its use.
Table 2: Approximate Carbon Activity for Carbon and Cr-Mo Alloy Steels (from [2])

These are the only changes made to the basic model, though actual C-0.5Mo allowable stresses and yield strengths are also used. In particular, void spacing (vs. temperature) is also left the same as for CS in lieu of evidence that there is any significant difference.
Model Results
Based on the C-0.5Mo model extensions described in the last section, performance is characterized by a single parameter, ac. Correspondingly, ac is varied to give the best fit to the available data. Although the data of Table 2 is not rigorously based on experimental or theoretical results (such as [4] for example), it does consider such work and is considered reasonable. Based on this, ac values required to match actual results would be expected to fall between 0.5 and 0.8. This is investigated in more depth in the next part of this series, but for the five MPC results addressed here this is indeed found to be the case with results falling between 0.5 and 0.7.
To predict through-wall damage, a through-wall hydrogen pressure profile is needed. For a one-sided exposure (as in a typical pressure vessel) the hydrogen pressure will vary parabolically from the full hydrogen partial pressure at the wetted surface to zero at the outside (see Section 5.2 of [1] for example). If a given point in the wall is unaffected by neighboring material, then the damage at any location is simply based on the hydrogen partial pressure at that location (all other things equal). This assumption is validated using finite element analysis where the complete HTHA model is programmed in a user subroutine and the stiffness of highly damaged material is removed. The increasing strain rate and decreasing stiffness of damaged material effectively redistributes all load to the less damaged material. It is found that differences in results due to load redistribution is modest up to about 40% wall. As 100% damage progresses to 50% wall and beyond, neglecting load redistribution becomes significantly and increasingly unconservative. For the cases here, the deepest extent of damage is only 29% such that the simple point pressure basis is an excellent approximation.
MPC-18 is presented first as it has the most data associated with it, followed by MPC-19, MPC-20, MPC-11 and MPC-3.
MPC-18
The through-wall results for MPC-18 are compared to the measured data in Figure 5. As shown in the figure an ac value of 0.635 gives the best match which is essentially the midpoint of the range given in Table 2 (i.e. “average” sort of behavior). The match to the through-wall data is quite close for the entire wall thickness, and as shown, there is negligible difference for the detailed time-history FEA results and the simplified results.

Figure 5: MPC-18 Predicted Through-Wall Damage
This is despite significant load redistribution as shown in Figure 6, where the through-wall stress is plotted for the final damaged state. While the stress increase in the outer wall appears significant, it is modest at the given temperature compared to the methane pressure values in the inner wall that drove the redistribution.
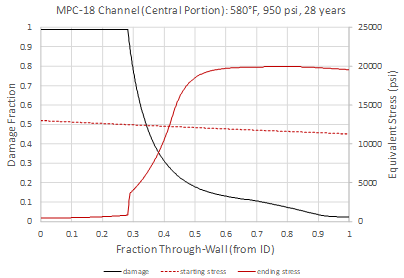
Figure 6: MPC-18 Predicted Through-Wall Damage and Re-Distributed Stress Profile
Finally, the character of the through-wall damage profiles is shown for several times in Figure 7. Early in the history the predicted damage is more linear (or even convex), but progressively transitions to a more and more nonlinear decrease through the wall as damage progresses.

Figure 7: MPC-18 Predicted Through-Wall Damage and Re-Distributed Stress Profile
MPC-19
MPC-19 is from a significantly cooler portion of the same heat exchanger channel that MPC-18 is from. The drop in temperature (500°F vs 580°F for MPC-18) would be expected to lead to much less damage than that seen in MPC-18, and indeed MPC-19 was shown to have about one third the grain boundary length attacked near the surface. Results of the ac calibration are shown in Figure 8, where a value of 0.7 is found to give an excellent match to the measured results (plotted with the definition of damage adopted here) of [1]. The value of 0.7 is on the higher end (with higher being worse since a value of 1 represents CS) and it is worth noting that MPC-19 was found to have a very poor Moly to Carbon ration; Mo/C = 1.71. This ratio, along with other factors such as heat treatment for example, play an important role in performance, and calibrations such as this can help to quantify their role in setting the (apparent or effective) ac value.
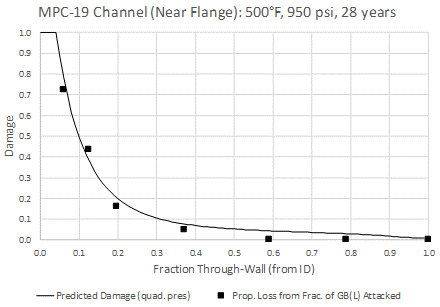
Figure 8: MPC-19 Predicted Through-Wall Damage
MPC-20
MPC-20 is again from the same heat exchanger as MPC-18, but in this case is taken from the tubesheet (complete thickness). There is a higher pressure (950 psi partial pressure), lower temperature side (“A”, 600°F) and a lower pressure (100 psi partial pressure) and higher temperature side (“B”, 700°F). The effect of each side through-wall is calculated separately and summed, with the conditions shown in Figure 9. Side A is the tube side, and as such, the through-thickness temperature will more closely follow it; however, actual flow conditions are unknown. For calibration purposes a parabolic increase in temperature is assumed with a 50°F maximum rise occurring at side B. Note that several temperature profile variations were investigated and while there is some effect on the predicted ac, it is not great.
The overall predicted damage profile is shown in Figure 10 and similar to MPC-18, an average sort of ac (0.58) is predicted to give an excellent match to the observed damage. As expected, the higher partial pressure side drives the damage, with only modest damage seen on the higher temperature, lower pressure side. Note that if operating conditions and the exact location of the sample were known, a more detailed heat transfer and stress analysis could be performed to refine the prediction and remove uncertainty. For the moment however the simple temperature conditions with 100% of allowable at temperature used as the applied stress gives very reasonable results.
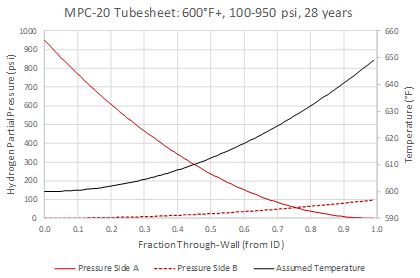
Figure 9: MPC-20 Through-Wall Pressure and Assumed Temperature

Figure 10: MPC-20 Predicted Through-Wall Damage
MPC-11
MPC-11 is from a different heat exchanger at a nozzle connection that operated at 670°F and 290 psi hydrogen partial pressure for 22 years. The connection is assumed to have been post-weld heat-treated (PWHT’d) although fabrication details are not known. The predicted and measured damage are overlaid on a macrograph of MPC-11 in Figure 11. As shown an ac of 0.49 is needed to match the level of damage measured on the inner wall, which, as shown in the image, is likely affected by stress concentrations from segregation-related blistering. The damage appears to drop off quite suddenly outside the region of segregation rolling bands such that the prediction is fairly conservative in this area. While this could be an artifact of the laminations and blistering, it is also possible that the stress state (both due to internal pressure at the nozzle junction and weld residual stress from the set-on nozzle, even in the PWHT state) is complex and includes mid-wall compression.
For illustration purposes, the predictions assuming varying (uniform) states of stress are provided in Figure 12. As shown, including compression (or simply neglecting tension) seems to give a better fit to the measured through-wall damage and gives higher values of ac, though all well within the range of expected values. It is worth noting though that stress state is an uncertainty and better understanding of the stress state could further improve predictions. This is further discussed for the next and final case, the sloped box (MPC-3).
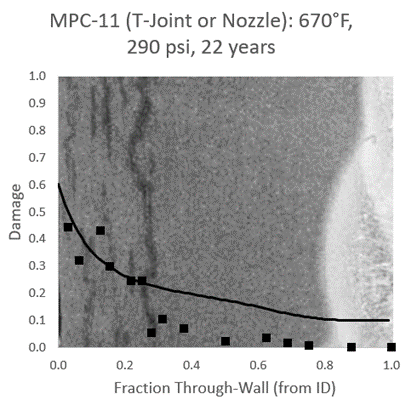
Figure 11: MPC-11 Predicted Through-Wall Damage

Figure 12: MPC-12 Predicted Through-Wall Damage for Different Stress States
MPC-3
MPC-3 was a sample of material not attacked in service (service conditions and duration unknown) used as part of shorter term experiment in [1]. The ex-service material was machined into a plate of varying thickness and then re-normalized before welding into a box assembly (“sloped box”). The assembly was externally pressurized and exposed to hydrogen on the external surface only for a short term test at 900°F and 900 psi hydrogen partial pressure (1248 hours) followed by 950°F and 900 psi (288 hours). The varying wall thickness was used to assess wall thickness effects and it was found that any thickness effect was minor; results are shown in Figure 13. The prediction in Figure 13 assumes no applied stress based on the result that there was no real thickness effect; for this assumption a good match to the data is found for ac = 0.5.
The sloped box reflects a fairly complex geometry and is an opportunity to look further at stress state effects. To this end a finite element elastic stress analysis is performed (without the HTHA strain rate and damage subroutine) which is illustrated in Figure 14. While the 44 mm thickness location is very nearly at zero stress for 900 psi external pressure, the thinnest location shows significant stress, although it is compressive at the hydrogen exposed surface. This applies to the center of the plate, since the stress drops off rapidly towards the edges.
While it’s not known where the damage was evaluated (center of the plate with maximum compressive stress vs. lower stressed regions), for illustration results are recalculated at each thickness location assuming the center of the plate was used.
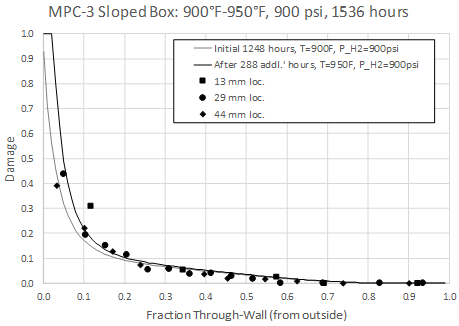
Figure 13: MPC-3 Predicted Through-Wall Damage – No Applied Stress

Figure 14: MPC-3 Finite Element Model Results
The maximum elastic stress profiles through-wall at the different thickness locations are shown in Figure 15; the results have been linearized, but with little effect as the raw stress profiles were essentially bending in nature to start with. The corresponding damage results are shown in Figure 16 – interestingly there does appear to be some effect of wall thickness, but the trend is opposite that expected for a compression reduction in void growth driving force. There are multiple possible explanations; for example, the sample may have been taken closer to the side wall. Weld residual stress is another complicating factor since the box was tested in the as-welded condition and at 900-950°F the effects of time-dependent relaxation would also be a factor.
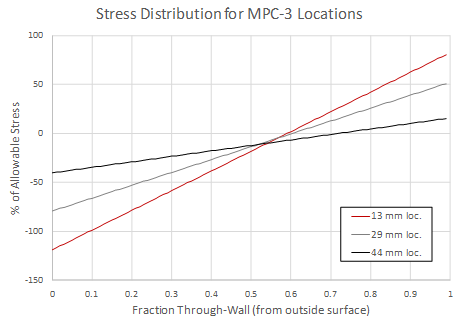
Figure 15: MPC-3 FEA-Based Stress Distributions
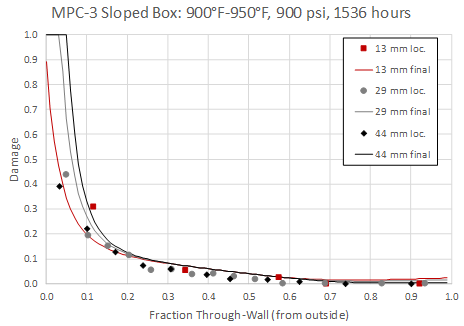
Figure 16: MPC-3 Predicted Through-Wall Damage
While the most likely explanation for the sloped box is that damage was not taken at the plate center, but at some point closer to the side wall where stresses would be dramatically lower as well as complicated by WRS, it is worth noting that experiments that carefully consider the effect stress state effects (particularly compression) could be useful in further fine-tuning model predictions. The simplest interim solution is to take no credit for compressive stresses (as in Figure 13), which from a calibration standpoint only changed the predicted ac from 0.53 to 0.5. This treatment would also be consistent with the results for MPC-11 which showed good correlation assuming zero applied stress. In most cases, simply assuming the stress levels equal to the allowable stress would be appropriate and conservative and would certainly be recommended in lieu of other information, or for any screening assessments.
Summary
This blog has presented validation to through-wall damage measured in five different samples, covering a range of conditions and durations, and with excellent results. To do so a formal definition of damage was developed based on two different physical measures, and the basic CS model described in [5] and the first blog in this series was extended to C-0.5Mo material. The model extension was accomplished using a single scaling parameter (ac), which in part is validated through the results presented here, and is further strengthened by calibration to API 941 data set presented in a subsequent blog. The effects of stress state were briefly introduced to look at sensitivity (in terms of calibration); while the effect is not great, careful testing to isolate this effect would be useful in further refining or validating the presented model.
becht.com
References
- Peng Liu, “Fundamental Studies of Hydrogen Attack in C-0.5Mo Steel and Weldments Applied in Petroleum and Petrochemical Industries,” in Department of Material Science and Engineering, 2001, The University of Tennessee (Doctoral Dissertation).
- API Technical Report 941-A, “The Technical Basis Document for API RP 941,” Addendum 1, June 2019. The American Petroleum Institute.
- Odette, G. R. and S. S. Vagarali, “An Equation-of-State for Methane for Modeling Hydrogen Attack in Ferritic Steels,” Metallurgical Transactions A, Volume 13a. February 1982.
- Schlögl, S. M., Y. V. Leeuwen and E. Van der Giessen, “On Methane Generation and Decarburization in Low-Alloy Cr-Mo Steels Dung Hydrogen Attack,” Metallurgical and Materials Transactions A, Volume 31A. January 2000.
- Dewees, D., G. Buchheim, J. Staats and C. Becht V, “Practical HTHA Experience and Time-Based Nelson Curves for Improved Equipment Life Management,” Inspectioneering, V(26)-2. March/April 2020.
Share This:


